EBAY: Can Its Price Go Down Ahead of Recessionary Signs?

SUMMARY
Note: For anyone who missed the BitcoinLive Information Webinar, here is the replay link: https://www.youtube.com/watch?v=32l40SNYOp4
As of June 4, ALL Crypto Analysis will be posted on the BitcoinLive channel and Steemit will be dedicated for Equity, Commodity and Options Analysis. To Signup for the BitcoinLive limited Founding Membership slots, use this link: https://get.bitcoin.live/haejin/
__
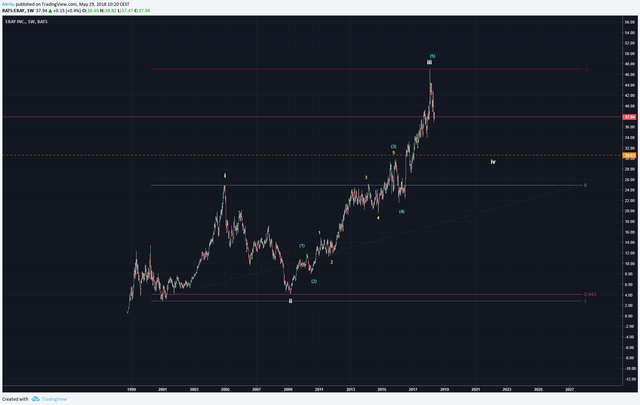
EBAY is showing that its Cycle degree of trend is completing wave 3. Since its an actionary wave, it has five subwaves as shown by the white EW. Blue wave 4 is likely next and is likely to retrace 38% of the rise. Also, wave 4 can't overlap with wave 1; this is why wave 4s don't usually retrace so deeply.

When less and less people buy form ebay or post items for sale, what could it mean? Perhaps economic slow down will dampen the transaction volume for EBAY? Could this coming blue wave 4 be the harbinger of a global slow down? The blue wave 4 is labeled as an ABC but can often take a triangle pattern. The subwaves of white circled wave 5 are shown in purple and seems complete. The red A wave could already be underway or complete and so a B bounce would make sense. With so many charts showing similar toppiness....would you be an active buyer with open arms or take caution?

Legal Disclaimer: I am not a financial advisor nor is any content in this article presented as financial advice. The information provided in this blog post and any other posts that I make and any accompanying material is for informational purposes only. It should not be considered financial or investment advice of any kind. One should consult with a financial or investment professional to determine what may be best for your individual needs. Plain English: This is only my opinion, make of it what you wish. What does this mean? It means it's not advice nor recommendation to either buy or sell anything! It's only meant for use as informative or entertainment purposes.
Please consider reviewing these Tutorials on:
Elliott Wave Counting Tutorial #1
Elliott Wave Counting Tutorial #2
Elliott Wave Counting Tutorial #3
Laddering and Buy/Sell Setups.
Laddering Example with EOS
Tutorial on the use of Fibonacci & Elliott Waves
@haejin's Trading Nuggets
Essay: Is Technical Analysis a Quantum Event?
Follow me on Twitter for Real Time Alerts!!
Follow me on StockTwits for UpDates!!
--
--


Hello haejin!
I believe and hope you are in love with the community here already.
For a start start, I would love to share with you tips that I trust will be helpful to you and your steem account and your followers and up voters:
I wish you more luck on your Steem journey! Follow us if you like to receive more helpful tips and maximize your Steemit experience.
Thank you
I just made this case by my own before looking at your charts.
One thing that I found to be amazing is how well this waves works in terms of retracement.
I was measuring retracement of subwaves of blue 3rd wave here.
2nd went to 0.5 of the 1st, 4th to the 0.382 of the 3rd [yellow]. So pretty much the same as you would expect after studying the EW book.
Blue subwaves hit the same fib ratios but even more precise.
And white 2nd wave went exactly to 0.942. And 3rd to -1.
