Gold To Silver Ratio’s Breakout Acts Like A Hot Knife Through Butter
How likely is the market volatility to impact our silver price forecast? We’ll also comment on the current opportunity in silver compared with the opportunity in the mining stocks.
Let’s start with a few questions that we received recently.
From the readers’ mailbag
Q: There have been statements circulating, mostly from those promoting physical precious metals, such as KITCO, etc.,that the physical silver prices are at a great premium to the paper (futures) prices, such as $1.50-$2 above spot prices. They are claiming there is a serious present shortage. However, my investment advisor tells me that there is, in fact, currently a significant glut of physical silver.
A: That’s more or less normal. The prices on the futures market change fast, and the physical side takes some time to adjust. Sellers view the moves in futures as very brief, and hoping that prices will move back up, they don’t want to sell their inventory at what they view as prices that are ridiculous and temporary. But as the time passes, the prices on the physical market adjust. The same thing happened in 2013 when silver was declining substantially. The physical market lagged, and people were claiming that the physical market remains strong and that it’s all temporary, manipulative, etc. Silver didn’t shoot back up then because of these claims, and it’s unlikely to soar back up for this reason right now. The emphasis goes on “for this reason,” as we expect silver to move higher in the very short term, and verify the breakdown by moving back up to the 2015 lows, before sliding further.
The reasons are emotional (technical) – no market moves in the same direction indefinitely.
Q: Please comment on the quote below:
"But it's the supply side that has changed the market. No matter what the idiot perma-bull silverbugs may claim, there is a glut of silver and the physical oversupply is from the big
base metals miners, e.g those with massive skarn or porphyry copper deposits in the Andes who suddenly started paying attention to their rather minor by-product credit a few years ago
when the streamer companies offered serious money for something they'd taken for granted until then."
A: First of all, we want to say that we think that silver will soar exceptionally in the following years, but not before sliding even more before, though. I like to think of myself as silver’s fan, but not a fanatic. I was one of the very few people who refused to view the gold-to-silver ratio at about 80 as something bullish. The supply of silver is indeed relatively un-elastic as it is mostly mined as a by-product. This is
one of the reasons that makes silver so volatile. If it declines, the supply cannot be quickly limited to balance the price. If it soars, the supply cannot be quickly increased to balance the price. It’s a double-edged sword that currently makes the declines so significant, but also one that is likely to make silver soar particularly sharply in the final part of the next long-term upleg.
Q: I have been told that extreme lows in the silver-gold ratio has in the past led to significant rallies.
A: In other words, extreme highs in the gold-to-silver ratio (as is currently) has in the past led to significant rallies (in gold and silver).
That’s true. The gold-to-silver ratio has been in a long-term horizontal trend for decades moving between 100 and 15. When a given resistance level in a trend (horizontal trend is still a trend) is being reached, it’s likely that the price or ratio (whatever was in the trend) is going to reverse. But it all changes dramatically once we see a breakout above the resistance level. That’s why breakouts (and their confirmations) are so important as a trading tool.
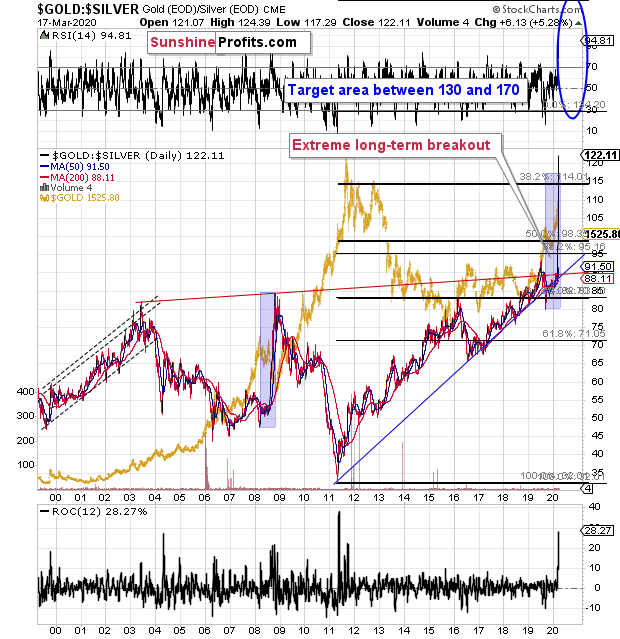
In case of the gold-to-silver ratio, we saw an extreme breakout. It normally takes at least several daily closes before a given breakout is confirmed. This kind of confirmation arrived but was not necessary because the breakout was so huge. It was definitely not accidental.
The breakout is a game-changer. It means that we are in uncharted waters and that it’s a tough call to say how high can the gold-to-silver ratio really rally, since it was just strong enough to pierce through a multi-decade resistance like a hot knife through butter.
The Fibonacci extension tool can be useful here. The point is to “extend” the previous major move in a given direction by a factor of 1.618, 2, or 2.618. The last two are most interesting as the extension based on 1.618, was already reached and broken.
Based on these extensions, we get targets of 134 and about 170 (barely visible on the above chart). If gold declines to $890 after all, then the gold to silver ratio at about 170 would correspond to about $5 – close to its all-time lows.
Crazy? Wasn’t it just as crazy to expect silver below $12 just a month ago?
Let’s take a closer look at silver’s very long-term chart.
Silver in the Spotlight
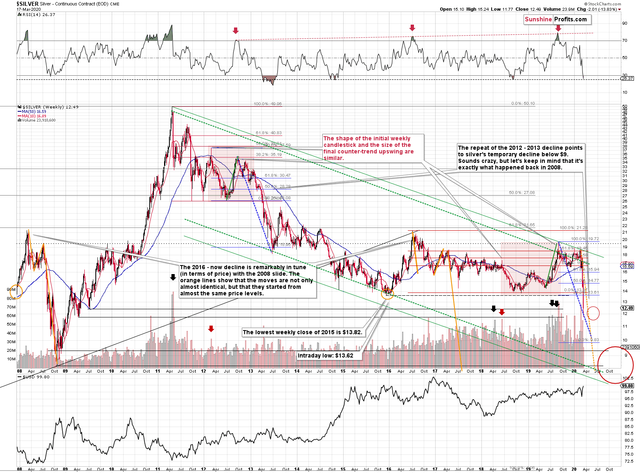
The analogy to 2008 that we outlined on Monday (and that we’ve been featuring for many months) clearly remains in place.
And so does the similarity to the 2012-2013 slide. The former is marked with yellow, and the latter is marked with blue.
Based on both analogies, it’s about time (and price) for silver to correct. Before declining even more.
The analogy to 2008 has been working remarkably well in terms of prices. That’s what the yellow lines represent. The most recent slide in silver is almost perfectly in tune with the initial sharp slide that we saw in 2008. Once you click on the chart to zoom in, you’ll see a thin black line that shows the size of the slide in 2008, and you’ll see that we copied it on the left side of the current decline. They are so similar that it’s shocking even for us – and we’ve been writing about this extreme similarity for many months.
How did silver perform then in 2008?
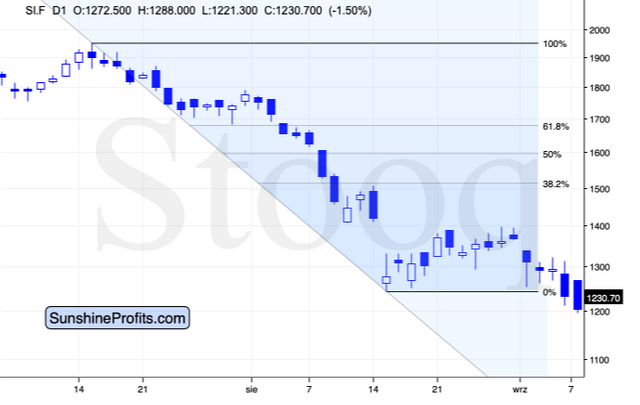
It corrected to the nearest strong horizontal resistance level and the relatively round number of $14. It was about midway between the bottom and the 38.2% Fibonacci retracement. There was a second bottom after the initial one, two days later.
How about the current situation?
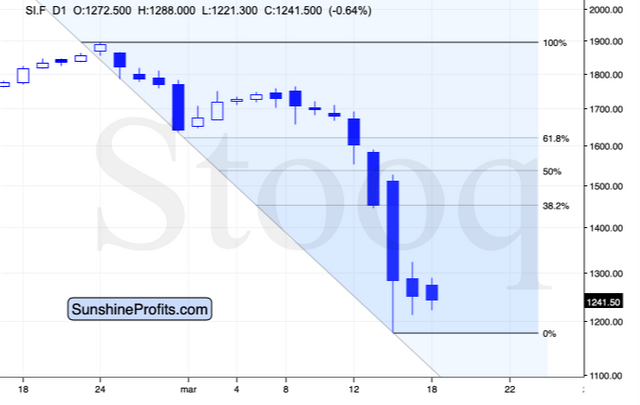
Silver moved lower today, and while it didn’t move between yesterday’s and Monday’s intraday low, it’s already very close. It will take silver only about 35 cents more to decline below yesterday’s low and to make this rebound extremely similar to what happened in 2008. Then again, that’s just a cherry on the analytical cake, and the analogy to 2008 will remain intact even if the shape of today’s session is a bit different.
Silver is now a bit lower than it was in 2008 in nominal terms, so the midpoint between the recent low and the 38.2% Fibonacci retracement is below the $14 level. Is there any significant horizontal resistance located over there? Of course, there is!
It’s the 2015 bottom – it formed at $13.62. This target is aligned with the mid-point between the recent low and the 38.2% Fibonacci retracement.
And the analogy to 2012-2013? Please note at what pace silver declined from the very first top (blue line). During the first very volatile slide, it corrected only after it reached the declining blue line. Guess what? Copying the same line to the recent final top (the 2019 one) provides us with a line that was just reached recently. This suggests that silver is about to rebound before moving again.
How high did silver rally during the analogous correction in 2013? It moved up by about 12.7%. Applying this kind of rally to the recent low in silver provides us with $11.77 * 1.127 = $13.26 as the target for the next local bottom. Of course, this analogy is not as precise as the 2008 one, so it can be used as its confirmation – this target is very close to the 2015 low.
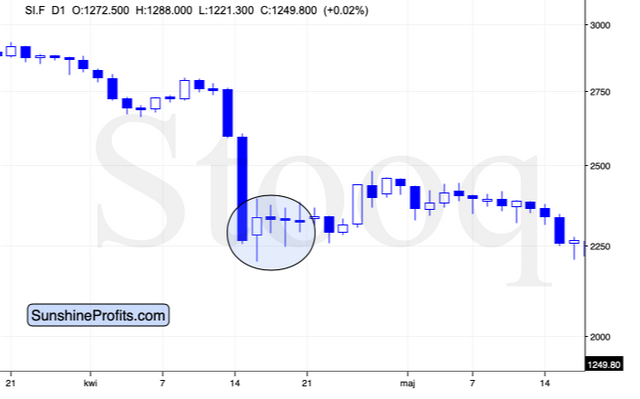
One more note regarding the 2013 corrective upswing. Please note that two days after the initial bottom, silver formed another local low and then rallied in the following days. That’s exactly the same way silver bottomed (temporarily) in 2008.
Today is two days after the initial bottom, so if silver moves temporarily lower today, please keep in mind that it’s normal, and it doesn’t invalidate the scenario in which silver now corrects higher.
This could be what’s likely ahead for the stock market and other commodities as well. The S&P 500 futures are lower so far today, but this might be the final move lower before their corrective rally. Crude oil moved lower as well and it might be bottoming shortly (we just cashed in profits on our short position in crude oil). In tune with the above, mining stocks could decline early today, only to move back up later and/or in the following days – we are not exiting our long positions in the miners at this time.
In fact, the best risk to reward opportunity continues to be in the mining stocks in our view, even though silver is about to correct upwards.
It is often the case that silver outperforms mining stocks in the final part of a given rally, but after examining how corrective upswings were shaped in different parts of the PM market during the 2008, 2011, and 2013 declines, it seems that this rule doesn’t really apply in case of quick rebounds within bigger declines.
If we see signs that miners are underperforming gold and that silver would still have some sizeable upside potential, we might switch our long positions from miners to silver. It’s too early to say if we’re going to do it or not.
Also, we would like to take this opportunity to explain why we are aiming to profit on miners’ rebound only. It’s not because we’re not forecasting gold or silver at (temporarily) higher prices. The corrective upswing is likely to take place, and it seems that it’s already in progress. The point is that miners are usually the first to rally after a bottom, and they became ridiculously oversold in the short run recently, which made their run-up most likely and created the most favorable risk to reward setup. That’s why our focus is over here right now. There will be many times, when diversification between gold, silver, and miners is the way to go, but right now, concentrating on the miners seems to be a better choice. This choice proved to be very lucrative over the last few days (especially that we entered the long positions in the miners in the final 25 minutes of Friday’s session, almost right at the intraday low).
Join the community in our migration to Hive, a community built blockchain for the community. All Steem account holders will receive equivalent stake on the new Hive blockchain.
Please see this post on SteemPeak for more information.
Hi! I am a robot. I just upvoted you! I found similar content that readers might be interested in:
https://www.silverdoctors.com/silver/silver-news/trader-silver-price-to-fall-to-5-gold-to-silver-ratio-to-170/