Bitcoin Price Analysis: Knock Arrows, Don't Loose
Bitcoin price pushed through an important trendline intersection today. The technical picture biases further toward a bullish outlook. Time for traders to take aim, but don’t loose your arrows just yet.
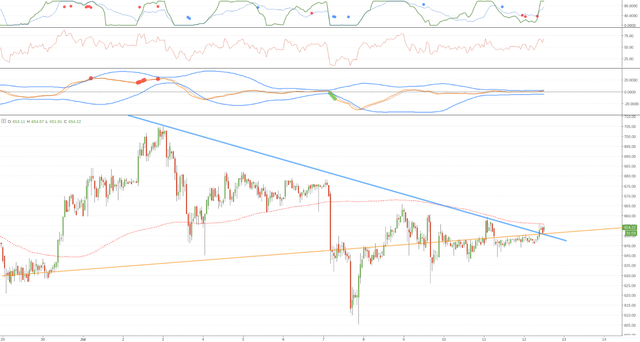
Time of analysis: 13h00 UTC The attached 1hr chart shows price action since the beginning of July. The orange line ascending from left to right is a Fib line that originates from the January 2015 low and it continues to attract price until now. The blue line descending from the top left of the chart is a trendline that originates at the June high and runs across all recent price highs since then. As the market often does, it advanced price above the upper trendline at a significant intersection. This could be a pivotal event in the chart: if price remains above both trendlines then we should see the start of advance. At the time of writing, a classic xbt.social trade signal is forming across timeframes, and a Buy Trade Recommendation is potentially only a few hours away. However, there is an additional xbt.social criterion that price should confirm advance by establishing above $680, the long-term support and resistance level dating back to 2013. Waiting for this confirmation allows the market lee-way to perform any interim tricks it may have its up sleeve. Bitcoin price has apparently crossed the Rubicon in the exchange price charts. While the outlook for advance has shifted further toward bullish bias, traders should remain cautious until advance is confirmed by price establishing above $680. Patience and caution – there will be sufficient upside distance once the rally gets underway. In the meantime there is risk of reversal before we see advance. Source : https://www.cryptocoinsnews.com/bitcoin-price-analysis-knock-arrows/
Bitcoin Price Analysis
Bitstamp 1-Hour Candle Chart

Summary
Bitfinex Depth Chart and Buy/Sell Volume

The calm before the storm, but what a time to be alive. Bitcoin and crypto coins are starting a revolution!
I upvoted you.