LET: Low-Temperature Electron Transport | Chapter 4 - Results and Discussion (Part 2/2)
In part 1, the results and discussion were presented for the metal samples of all thicknesses. This part will finish off the results and discussion for the Alloy, Kondo and Superconducting samples.

4.3 - Alloy Samples
The same steps were carried out to analyse alloy samples. Four different samples of thickness 500Å containing different concentrations of Copper and Nickel were used. Again, 30mA current was chosen for all samples.
4.3.1 - 100% Copper
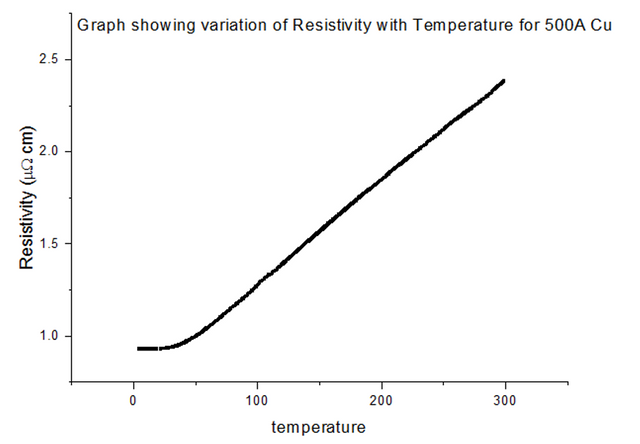
The Resistivity vs Temperature graph for 100% Copper, is shown below, in figure 24.
4.3.2 - 62% Copper and 38% Nickel
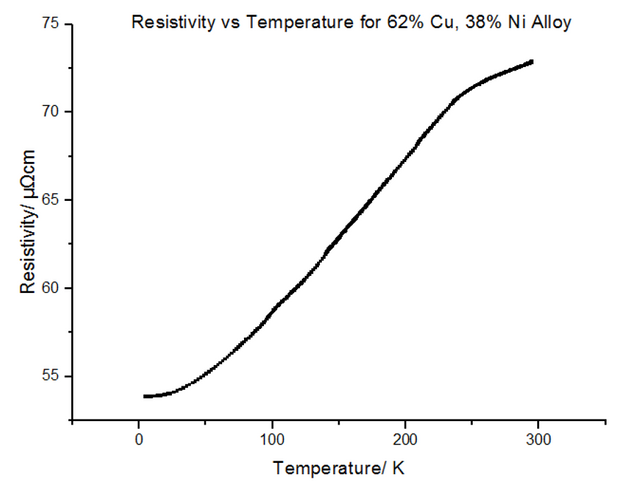
The Resistivity vs Temperature graph for 62% Copper 38% Nickel, is shown below, in figure 25.
4.3.3 - 50% Copper and 50% Nickel
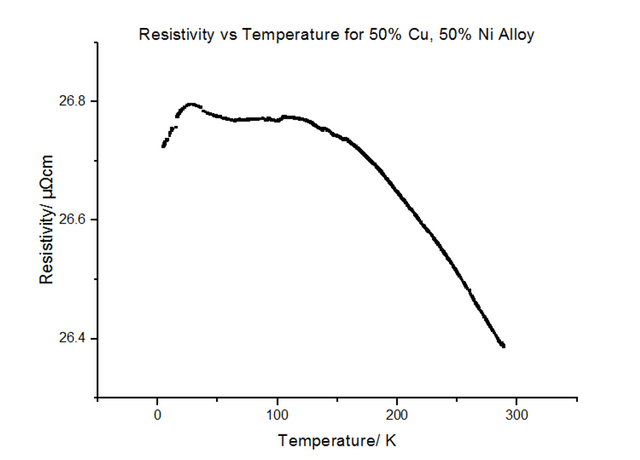
The Resistivity vs Temperature graph for 50% Copper 50% Nickel, is shown below, in figure 26.
4.3.4 - 100% Nickel
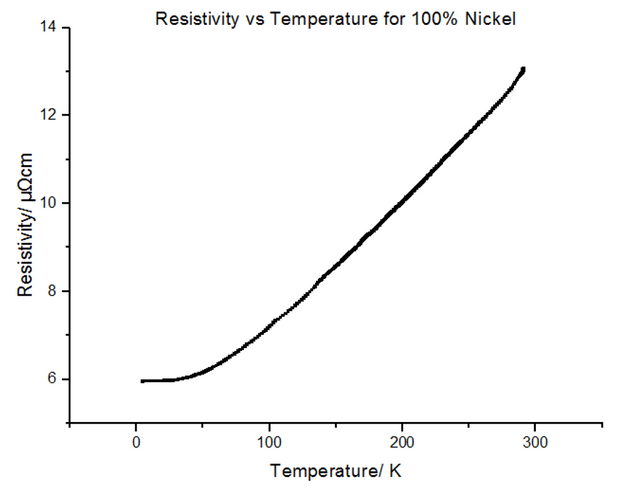
The Resistivity vs Temperature graph for 100% Nickel, is shown below, in figure 27.
4.3.5 - Summary of Alloys
The alloys seemed to have much higher resistivity values than their pure components. In fact, the resistivity for the 50:50 Copper-Nickel sample did not seem to be temperature dependant, i.e. the trend did not follow the usual T0 to T5 to T, as it did for metals. Another graph was plotted showing the variation of the resistivity with the % composition of Nickel, shown in figure 28 below.
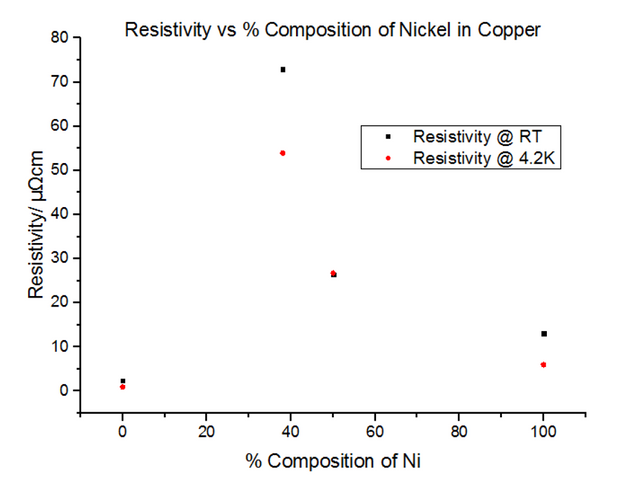
Since pure Nickel and pure Copper are metals, not alloys, the graphs look very similar to the metal data acquired in section 4.2. This is because the metals themselves have their own intrinsic resistivity values, where:
As can be seen, the large increase in resistivity for low Nickel contributions of under 20% can be explained by studying how the structure of Copper metal changes as more Nickel is added. As Nickel is progressively added to Copper, the Nickel acts as an impurity and disrupts the metallic structure of Copper; as a result, ρI increases, in turn affecting the residual resistivity, whereas ρL remains unchanged. This results in the slope looking the exact same, with it being translated up and down the y axis depending on the concentration of impurities in the metal. Figure 29, below, illustrates this well.
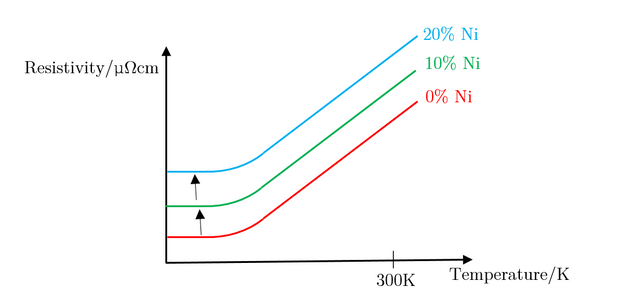
The above explains concentrations of impurities of up to 20%, but does not explain what occurs when this percentage is exceeded. Due to the different atomic sizes and valences of Nickel and Copper, scattering probabilities become higher and higher due to the change in the lattice parameter. Differences in electron densities, lead to different positions of Fermi energies, which in turn alters the population density and therefore the conductivity and resistivity [7]. Copper has one more valence electron than Nickel. Since Copper’s d-shell electron density is about ten times greater than that of its s-shell, the d-shells become full when 60% Copper is added to Nickel. This leads to the electron spins cancelling out, meaning there is no magnetisation. This explains the maximum resistivity at Copper 62% Nickel 38%. Deviating from this concentration decreases the resistivity.
4.4 - Kondo Samples
Three different Kondo samples, containing Copper and Iron, of unknown concentrations were dipped and their Resistivity vs Temperature graphs were extracted from the scans. A Gaussian was then fitted to the troughs of the data, to calculate the minimum, as shown below in figures 30, 31 and 32.
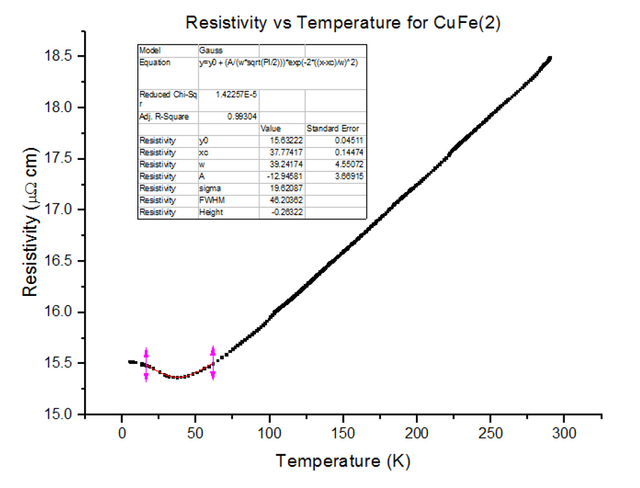
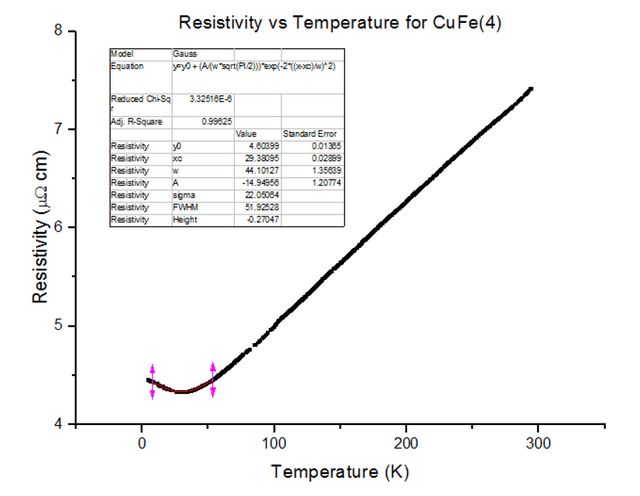
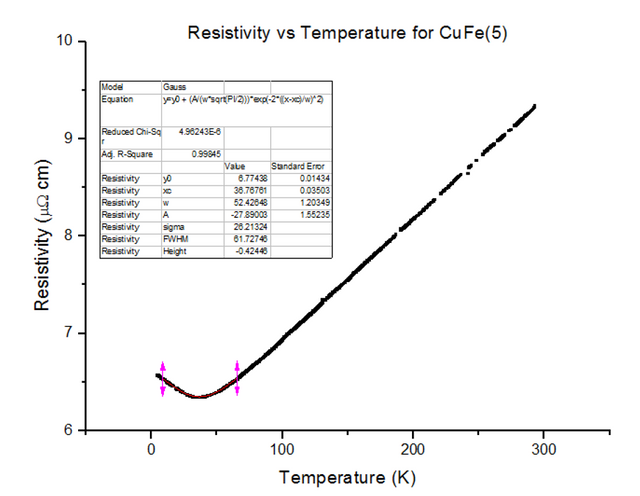
As can be seen, the resistivity started to rise as temperatures kept dropping towards 4.2K, for each of the Kondo samples. This, again, is due to the physical structure of the sample. Magnetic ions found in non-magnetic crystals; i.e. Iron found in Copper, give rise to the Kondo effect with varying temperatures. These magnetic ions retain their magnetic moment; essentially, small magnets are distributed throughout the Kondo crystal. Since the crystal is a metal, the conduction electrons scatter due to the magnetic impurities. Since the magnetic impurities and conduction electrons both have spin, they can mutually flip spins while scattering. The spin-flip scattering is strong at low temperatures, therefore, slightly increases the resistivity as temperatures further decrease [8].
4.4.1 - Calculating the Unknown Concentrations
The position of the minimum on the graphs varies as 1/5 the power of the concentration of the magnetic impurity, as shown in equation 5:

To derive this relation, the Kondo equation is substituted into the Bloch Gruneisen function and differentiated to find out Tmin. Since the Tmin values have been extracted, they can be plugged into the rearranged and simplified equation:

This gave concentrations of (in parts per million):
- CuFe(2) = 3000ppm
- CuFe(4) = 1000ppm
- CuFe(5) = 2000ppm
Since the true concentrations of the samples were not known, these values could not be compared or be given a valid conclusion.
4.4.2 - Calculating the Kondo temperatures
From the data acquired, the Kondo temperatures could not be calculated. The Kondo temperature is the temperature at which the resistivity stabilises after rising at sub-zero temperatures. At 4.2K, this temperature was not cold enough for the Kondo samples to exhibit this effect on the graph. According to one study, the Kondo temperature for Copper with Iron impurities is 24K [9].
4.5 - Superconductor Samples
Three Superconducting Niobium samples of different thicknesses were dipped into the liquid helium and the Resistivity vs Temperature graphs were extracted from the data acquired. The graphs, with their thicknesses, are shown below, in figures 33, 34 and 35.
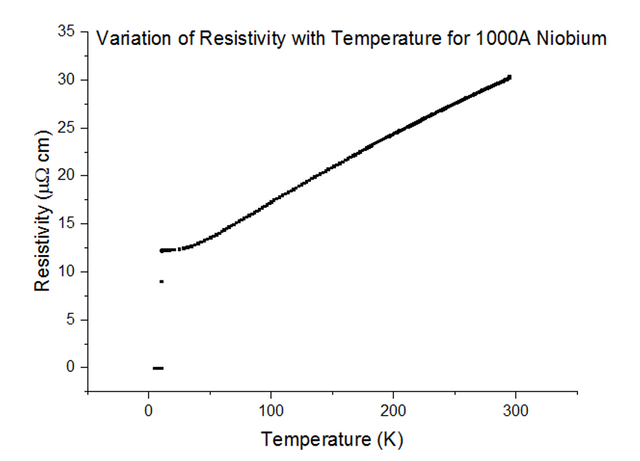
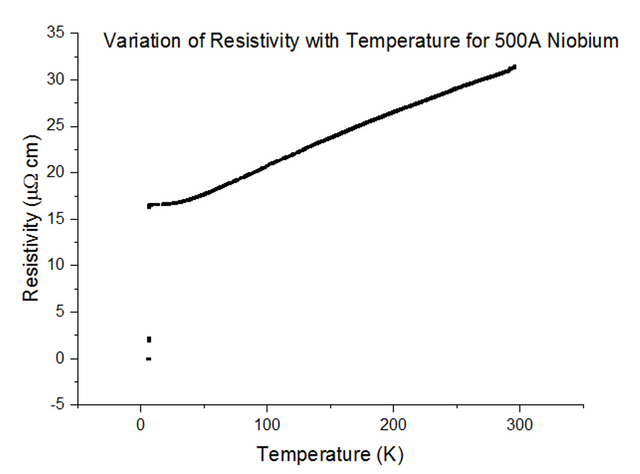
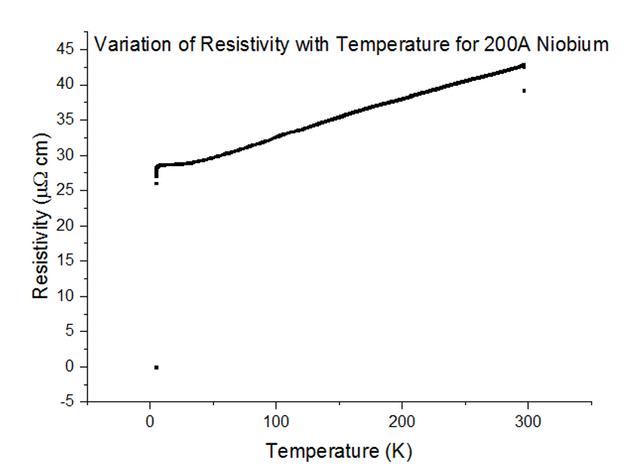
As can be seen, the resistivity instantly drops to 0 at a specific temperature. Since the resistivity drops to 0, the resistance must have also dropped to 0, which is the special effect of Superconductivity. The temperatures at which Niobium began to superconduct are:
The book value of the temperature at which Niobium should begin to superconduct, is 9.46K [10]. This was not the case from what has been observed. The positioning of the thermometer on the probe stick can be to blame; i.e. the sample is placed about 10cm deeper than the thermometer at any one time, as the probe stick is being dipped. This means that the temperature registered could be a notable fraction of a degree higher than the true temperature of the sample. Although this explains just the result for Niobium at 1000Å, another issue to note is that as the thickness of the sample becomes more and more thin, the percentage of impurities starts to rise. Since Niobium of such a small thickness is not pure, the results acquired may be skewed to some degree.
If you have any questions, leave them below and until next time, take care.
~ Mystifact
References:
[7]: Fert, A, Campbell, I. 1976. Electrical resistivity of ferromagnetic nickel and iron based alloys. [08/04/2018]. Available from: http://iopscience.iop.org/article/10.1088/0305-4608/6/5/025/pdf
[8]: Blachy, M, Giordano, N. 1994. Kondo effect in Cu(Fe) films. [10/04/2018]. Available from: https://journals.aps.org/prb/abstract/10.1103/PhysRevB.49.6788
[9]: Mahan, G. 2016. Crystal. [12/04/2018]. Available from: https://www.britannica.com/contributor/Gerald-D-Mahan/4076
[10]: Rohlf, J. 1994. Modern Physics from alpha to Z0. USA. Wiley
[11]: Ramadan, A, et al. 1994. On the vdP method of resistivity measurements. Thin Solid Films. 239. 272-275
Please note; no copyright infringement is intended. All images used have been labelled for re-use on Google Images. If any artist or designer has any issues with any of the content used in this article, please don’t hesitate to contact me to correct the issue.
Previous LET chapters:
Chapter 1 - Abstract
Chapter 2 - Introduction
Chapter 3 - Experimental Techniques
Chapter 4 - Results and Discussion (Part 1)
Next chapter:
Chapter 5 - Conclusion
Follow me on: Facebook, Twitter and Instagram, and be sure to subscribe to my website!