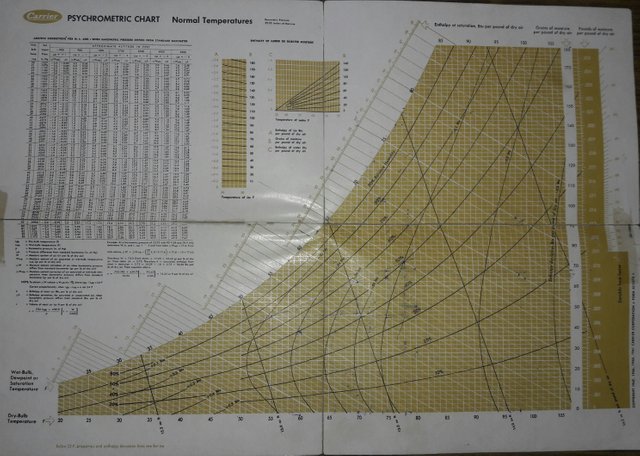
psychrometric chart
Psychrometric charts are graphic representations of the psychrometric properties of air. By using psychrometric charts HVAC engineers can graphically analyze different types of psychrometric processes and find solution to many practical problems without having to carry out long and tedious mathematical calculations.

The psychrometric chart looks complicated with vast numbers of lines and curves in it, but is very easy to understand if you know the basic properties of air. You will also understand its worth when you actually use it considering the fact that you won’t have to use any formulae to find the properties of air in different conditions, all you will have to know is two parameters of air and the rest are easily found on the chart.
.jpeg)
The psychrometric chart shows graphically the parameters relating to water moisture in air. This application note describes the purpose and use of the psychrometric chart as it affects the HVAC engineer or technician.

Air comprises approximately 78% nitrogen, 21% oxygen, and 1% other gases. But air is never dry, even in a desert. Two-thirds of the earth’s surface is covered with water and this, along with other surface water and rain, maintain low pressure water vapor to be suspended in the air making up part of the 1% of other gases. The psychrometric chart indicates the properties of this water vapor through the following parameters, each of which is explained in more detail below:
dry bulb temperature
wet bulb temperature
dew point temperature
relative humidity moisture content
enthalpy
specific volume
You remembered me my college days, there only we use to learn those things in air conditioning chapter. Today after reading your blog its like i revised it. Thanks
Congratulations @sunilsurya! You received a personal award!
You can view your badges on your Steem Board and compare to others on the Steem Ranking
Vote for @Steemitboard as a witness to get one more award and increased upvotes!