DIY Steemit Statistics with Python: Part 7 - Payouts
The last 6 charts in the @arcange report are dedicated to payouts.
Preparation
Before we start, we prepare the workspace as usual (see the previous posts in the series for additional context: 1, 2, 3, 4, 5, 6):
%matplotlib inline
import sqlalchemy as sa, pandas as pd, seaborn as sns, matplotlib.pyplot as plt

sns.set_style()
e = sa.create_engine('mssql+pymssql://steemit:[email protected]/DBSteem')

def sql(query, index_col=None):
    return pd.read_sql(query, e, index_col=index_col)
Payouts
Payouts for a post depend on how many "reward shares" it receives from the voters. Computing the actual payout from the raw voting activity recorded in the blockchain and correctly accounting for all details could be a bit tricky.
Luckily for us, SteemSQL does the hard accounting job for us and is helpfully keeping track of pending and previous payouts for every post and comment. This data is kept in the Comments table (not to be confused with TxComments):
sql("""select top 5
            author,
            permlink,
            pending_payout_value,
            total_pending_payout_value,
            total_payout_value,
            curator_payout_value
        from Comments""")
| author | permlink | pending_payout_value | total_pending_payout_value | total_payout_value | curator_payout_value | |
|---|---|---|---|---|---|---|
| 0 | steemit | firstpost | 0.0 | 0.0 | 0.94 | 0.76 |
| 1 | admin | firstpost | 0.0 | 0.0 | 0.00 | 0.00 |
| 2 | proskynneo | steemit-firstpost-1 | 0.0 | 0.0 | 1.06 | 1.06 |
| 3 | red | steemit-firstpost-2 | 0.0 | 0.0 | 0.10 | 0.10 |
| 4 | red | red-dailydecrypt-1 | 0.0 | 0.0 | 1.02 | 1.02 |
As we see, the table, somewhat confusingly, keeps track of multiple "payout" categories. For the purposes of our charts we will simply sum all payouts and pending payouts together.
Highest Payout
Let us start by looking at the highest payout per day.
max_daily_payout = sql("""
select
    cast(created as date) as Date,
    max(pending_payout_value
        + total_pending_payout_value
        + total_payout_value
        + curator_payout_value) as Payout
from Comments
group by cast(created as date)
order by Date
""", "Date")
Plotting is business as usual:
max_daily_payout.plot(title="Highest daily payout (SBD)")
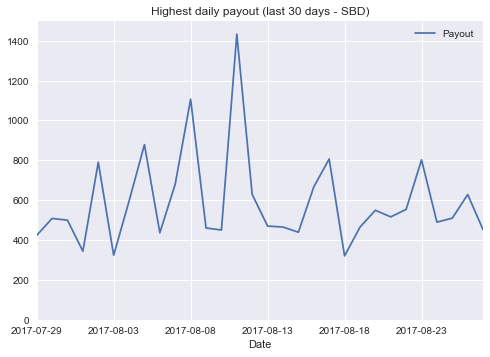
max_daily_payout[-30:].plot(title="Highest daily payout (last 30 days - SBD)",
ylim=(0,1500));
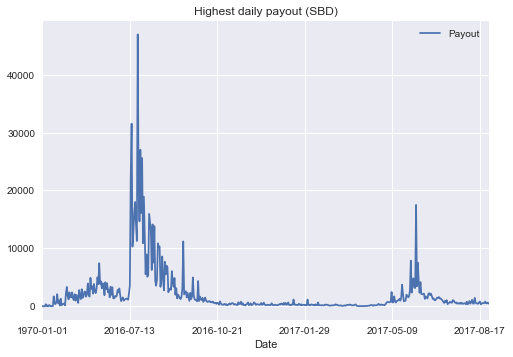
Interestingly enough, there seems to exist a post with a payout of more than $45K. Let us find it:
superpost = sql("""
    select * from Comments
    where pending_payout_value
        + total_pending_payout_value
        + total_payout_value
        + curator_payout_value > 45000""")
superpost[['author', 'category', 'permlink']]
| author | category | permlink | |
|---|---|---|---|
| 0 | xeroc | piston | piston-web-first-open-source-steem-gui---searc... |
Here is this post.
Total and Average Daily Payouts
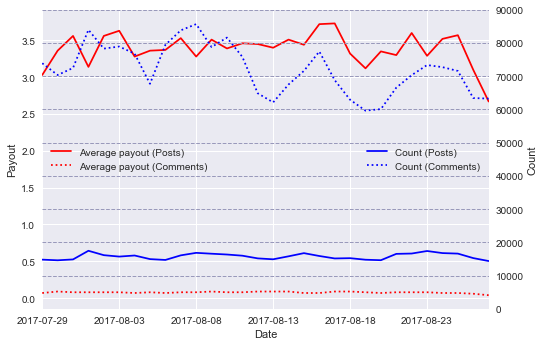
The query to compute the total or average payouts as well as the number of posts per day is analogous. In fact, we can compute all such statistics in one shot. Let us compute the average daily payout for posts and comments separately.
avg_payouts = sql("""
with TotalPayouts as (
    select
        cast(created as date) as [Date],
        iif(parent_author = '', 1, 0) as IsPost,
        pending_payout_value
            + total_pending_payout_value
            + total_payout_value
            + curator_payout_value as Payout
    from Comments
)
select
    Date,
    IsPost,
    avg(Payout) as Payout,
    count(*)    as Number
from TotalPayouts
group by Date, IsPost
order by Date, IsPost
""", "Date")
Observe how we can display plots which use two different Y-axes on the same chart:
posts = avg_payouts[avg_payouts.IsPost == 1][-30:]
comments = avg_payouts[avg_payouts.IsPost == 0][-30:]
fig, ax = plt.subplots()

# Plot payouts using left y-axis
posts.Payout.plot(ax=ax, c='r', label='Average payout (Posts)')
comments.Payout.plot(ax=ax, c='r', ls=':', label='Average payout (Comments)')
ax.set_ylabel('Payout')
ax.legend(loc='center left')

# Plot post counts using right y-axis
ax2 = ax.twinx()
posts.Number.plot(ax=ax2, c='b', label='Count (Posts)')
comments.Number.plot(ax=ax2, c='b', ls=':', label='Count (Comments)',
                     ylim=(0,90000))
ax2.set_ylabel('Count')
ax2.legend(loc='center right')
ax2.grid(ls='--', c='#9999bb')
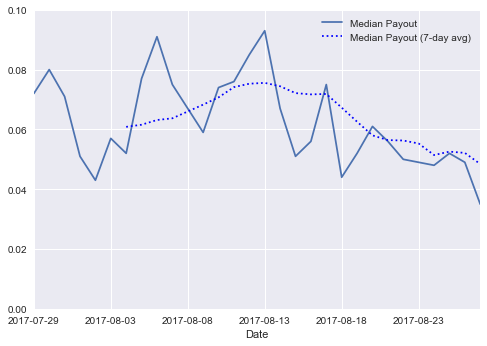
Median Payout
SQL Server does not have a median aggregation function, which makes the query for computing the daily median post payout somewhat different:
median_payout = sql("""
with TotalPayouts as (
    select
        cast(created as date) as [Date],
        pending_payout_value
            + total_pending_payout_value
            + total_payout_value
            + curator_payout_value as Payout
    from Comments
    where parent_author = ''
)
select distinct
    Date,
    percentile_cont(0.5)
        within group(order by Payout)
        over(partition by Date) as [Median Payout]
from TotalPayouts
order by Date
""", "Date")
Just like @arcange, let us plot the median payout along with a 7-day rolling average.
df = median_payout[-30:]
df.plot(ylim=(0,0.1))
df['Median Payout'].rolling(7).mean().plot(
                   label='Median Payout (7-day avg)', ls=':', c='b')
plt.legend();
This completes the reproduction of the charts in the @arcange's "Steemit Statistics" posts.
In the next episode we will be reproducing @arcange's Daily Hit Parades.
The source code of this post is also available as a Jupyter Notebook.
Very great and detailed reproduction!
hi @konstantint, you post is awesome and under valued. Keep up the good work
Thanks for the positive feedback! Feel free to resteem if you believe the post could benefit from additional exposure :)
I though I did resteem, sorry Have done now :-)
Excuse ignorance but is this how you code Python , I was intrested in R myself but also heard alot about Python
Yes, this is Python (take note of the main category of this post ;)
You may do similar kinds of things in R as well, however if you are just starting to get acquainted with the field and have the luxury of choosing your first language arbitrarily, I would recommend considering Python.
The Python community is larger and many of the state of the art machine learning methods (which I do plan to eventually reach with this series of posts, in particular) are somewhat easier to work with in Python, in my opinion.
Wow, great job. This is some high quality, well presented, and sadly undervalued, analysis. I guess there aren't a lot of data scientists on Steemit who appreciate this yet?