Russia Is Now Running an Incredible $200bn Trade Surplus
Part of the story is the domestic agriculture boom reducing the need for food imports
by Ben Aris
Russian customs reports that in 2018 the country’s goods trade surplus climbed to $212bn, or roughly 12% of GDP. Russia is now running a triple surplus again for the first time in years: trade, current account and federal budget. Both the budget and the current account surpluses are at record levels. The record trade surplus was driven partly by the rise in oil prices in 2018, but falling imports, especially falling food imports, played at least as important a role.
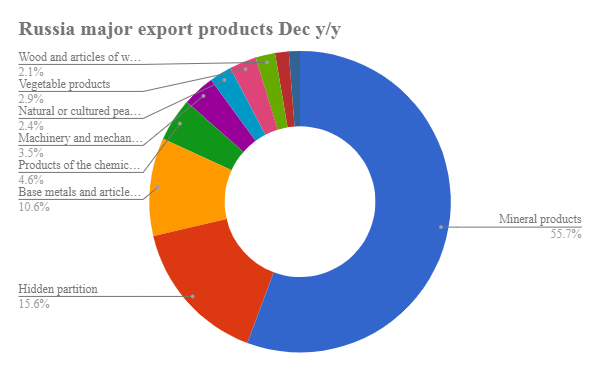
Exports remain heavily weighted towards hydrocarbons, which totalled $260bn in December – more than half of Russia’s exports, with minerals and base metals making up another $48.7bn from the total of $461bn.
Imports are half as much as Russia’s exports, which has led to the record current account surplus in 2018. Imports are more evenly distributed but the top four items – machinery ($80.7bn), chemicals ($32.4bn), vehicles ($28.4bn), and base metals ($18.5bn) – accounting for 70% of the total imports to Russia.
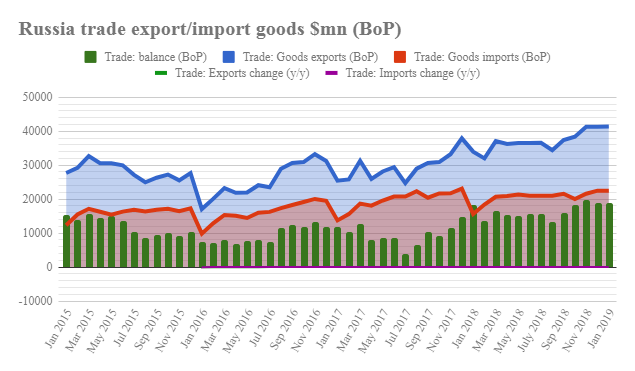
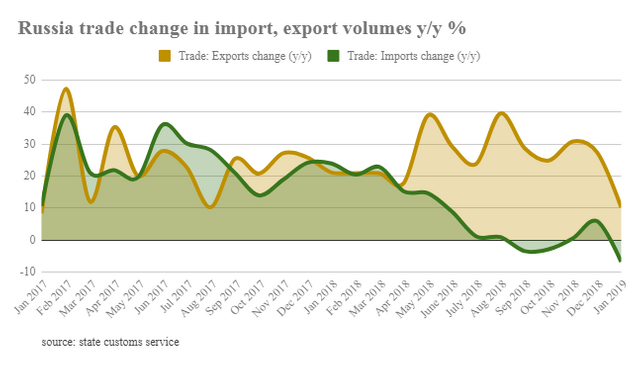
One of the main drivers of the growing trade balance has not been growing exports or rising oil prices, although that has contributed to the record, but as important, or more so, has been falling imports, which were flat or decreasing in 2018, especially in the second half of last year. This is partly due to the falling real incomes in 2018, down for the fifth year in a row.
The second factor driving down imports is Russia’s increasing self-reliance in food production. Russia’s imports of meat and meat products plummeted by almost 58% to 800,000 tonnes over the past four years since introduction of sanctions and counter-sanctions, Sergei Dankvert, director of the Federal Service for Veterinary and Phytosanitary Oversight, said in an interview with Rossiya 1 channel in February.
“We have interesting figures to share. Let’s take the year of 2014. We imported almost 1.9 million tonnes of all types of meat and meat products then. Now let’s have a look at the past year, and we see only 800,000 tonnes. We’ve replaced almost 1 million tonnes over the four years,” he said. “If we look at milk and dairy products, we had 1.164 million tonnes (imported in 2014), and now we have only 790,000 tonnes,” he said. He added that imports from Belarus amount to about 350,000 tonnes, and imports of dairy products and milk from all other countries amounts to about 450,000 tonnes. The reduction of imports happened simultaneously with an increase in domestic production, he added.
Country-wise, China has become the single most important partner, accounting for 12.4% ($60.6bn) of Russia’s exports in December and 22% ($56.9bn) of its imports. European countries feature heavily as Russian export markets, but the US accounts for only 2.8% ($13.5bn) of Russia’s exports, although it is the third most important source of imports, accounting for 5.3% ($13.9bn) of Russia’s total imports in December.
As an aside Russia is much less exposed to Brexit than its peers in Central Europe as the UK accounted for only 2.1% ($10.4bn) of Russia’s exports and 1.7% ($4.4bn) of its imports in December. That puts the UK on a par with Ukraine which has the same export numbers, but ranks above the UK in terms of imports: Ukraine accounted for 2.3% ($6bn) in December and continues to run an almost $2bn trade deficit with Russia.
Russian goods exports rose by 26% from the previous year. This reflects changes in both quantities and prices. Some of these may prove to be temporary. Energy prices are a major driver of fluctuations in Russia’s case, Bank of Finland Institute for Economies in Transition (BOFIT) reports.
The EU accounted for 46% of Russian exports, while 12% went to China. Two-thirds of earnings from goods exports came from fossil fuels. The combination of a slight increase in oil and gas export volumes and higher world prices raised export earnings by a third. In addition to fossil fuels, there were also significant increases in exports of metals and grains. With the bumper crop of autumn 2017, 2018 wheat exports were up by a third from 2017. Russia produces about 10% of the world’s wheat. In recent years, about half of Russia’s wheat production has gone to exports.
The trend in exports last year was not reflected in imports. Russians spent only 5% more on imported goods in 2018 than in the previous year. Import growth was depressed by the ruble depreciation of more than 10% against the dollar and euro.
About 37% of Russia’s goods imports last year came from the EU and 22% from China. While half of imports consisted of machinery, equipment and vehicles, growth in the category was modest. Pharmaceuticals and foodstuffs were also important import good categories.
Preliminary balance of payments figures for the fourth quarter of 2018 show Russian revenues from exports of goods and services were up nearly 20% y/y even if the growth was no longer as fast as in the previous quarter. For the entire year, export earnings were up by over 20% as revenues from energy exports ballooned by over 30% on strong export prices.
Russia’s spending on imports of goods and services in the second half of last year was unchanged from 2H17. For all of 2018, spending on imports was up by a few percent. The spending of Russian travellers abroad was up by about 10% for the year although the growth stopped in the fourth quarter. The overwhelming underlying factor was ruble depreciation. Total spending on imports of goods and services in the second half of last year roughly matched 2008 and 2010 levels.
The gap between export earnings and spending on imports widened in 2018 to produce a whopping current account surplus of about 7% of GDP – Russia’s largest current account surplus since 2006.
The net capital outflow from the private sector increased substantially in 2018. The flow of direct investments from abroad into the Russian corporate sector (excluding banks) dried up almost entirely, while FDI outflows from Russia remained rather notable. Similar to 2017, banks’ capital outflow abroad mostly arose from decreases in their foreign liabilities.
Trade turnover between Russia and China in January 2019 increased by 10.8% on an annualised basis to $9.2bn, China's General Administration of Customs said in a report issued on Thursday. China's exports to Russia grew by 11.5% in the first month of 2019 and exceeded $4.3bn. Russia's exports to China also increased by 10.2% to $4.89bn. In 2018 trade turnover between Russia and China increased by 27.1% on an annualised basis to $107bn. Russia and China are hoping to grow trade turnover from $100bn in 2018 to $200bn by 2020.
The Russian Federation remained Ukraine’s main trade partner in 2018, despite mutual trade restrictions imposed in 2016. In 2018, Ukrainian exports to other countries amounted to $47.3bn, an increase of 9.4% compared with 2017, according to the figures released by the State Statistics Service on February 19. The biggest share of the country’s exports ($3.7bn) still falls on Russia, despite a 7.2% decrease, which is followed by Poland ($3.3bn), Italy ($2.6bn), Turkey ($2.4bn), Germany and China ($2.2bn each). All in all, 42.5% of Ukrainian exports ($20.2bn) were to EU countries last year. Among importers, Russia also remains the first. In 2018, imports of Russian goods to Ukraine rose by 12.3% compared with 2017 to $8.1bn. China was the second ($7.6bn), followed by Germany ($5.9bn), Belarus ($3.8bn), and Poland ($3.6bn). Total Ukrainian imports equaled $57.1bn last year, an increase of 15.2% compared with 2017, with 40% ($23.2bn) from EU countries.
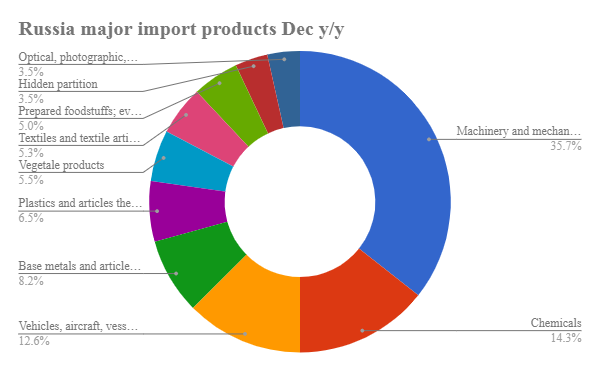
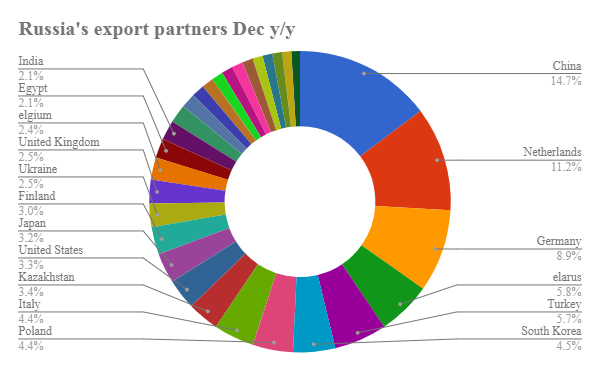
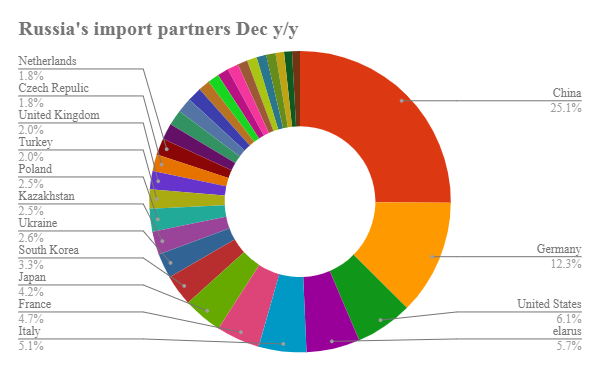
Source: bne IntelliNews
Warning! This user is on my black list, likely as a known plagiarist, spammer or ID thief. Please be cautious with this post!
If you believe this is an error, please chat with us in the #cheetah-appeals channel in our discord.