SEC | S20W1 | Spreadsheet Essential For Beginners (Spreadsheet Overview, Spreadsheet Interface & Basic Formulas)
AssalamuAlaikum & Greetings Everyone!
It's me @amjadsharif
From #pakistan
AssalamuAlaikum & Greetings Everyone!
It's me @amjadsharif
From #pakistan
It is my honor to participate in this spreadsheet lecture and I hope to learn a lot from it. I also thank the teachers.

| Explain your understanding of the Spreadsheet, listing its features, its purposes, and an example image that follows your explanation. |
|---|
A spreadsheet is one such software. which is used to organize and analyze data. It has rows and columns. The following are the features of a spreadsheet in which information can be seen below:
Data entry:
A spreadsheet has cells and columns where you enter different types of data, such as numeric data, dates, and social data.
Formulas and Calculations:
Can perform calculations using various formulas in the spreadsheet like addition, subtraction, multiplication, division and average etc.
Charts and Graphics:
Charts like bar charts, pie charts, etc. are created to facilitate data analysis.
Formatting:
Formatting is used to beautify and organize data, such as color font and bold.
Purpose:
The purpose of a spreadsheet is to organize information, perform calculations and analyze data to make the better decisions.
Example Image
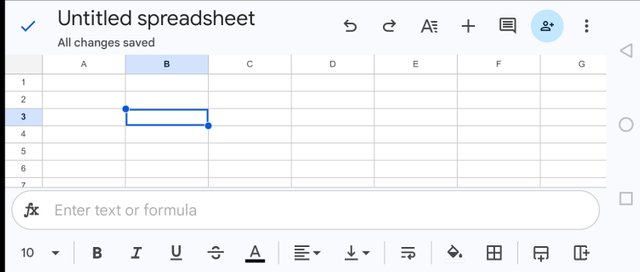
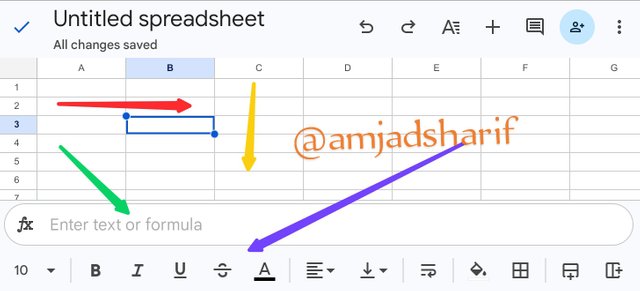
Here is the example of sheet that I understand.
- Red arrow indicates Rows.
- Yellow arrow indicates Rolumns.
- Green arrow indicates Formula Bar.
- Blue arrow indicates Toolbar.
| Based on the basic Formulas given in this lecture, use the data below to calculate the SUM Function and the AVERAGE Function of the class. Show clear working as to how you arrive at your answers. |
|---|
Using the given data below we will calculate the sum and average function. This explanation will be presented in an easy, simple and professional manner so that you can understand it better.
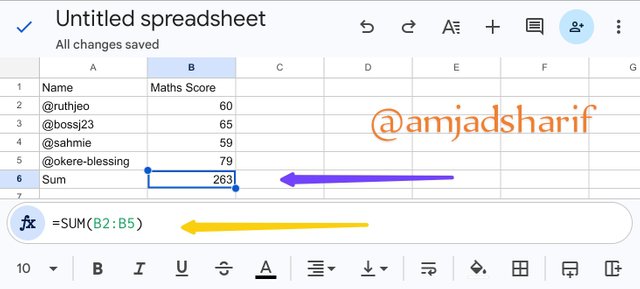
SUM Function
First of all I entered the given data and then apply the sum formula in formula bar.
- Yellow arrow indicates formula in formula bar.
- Blue arrow indicates result of sum.
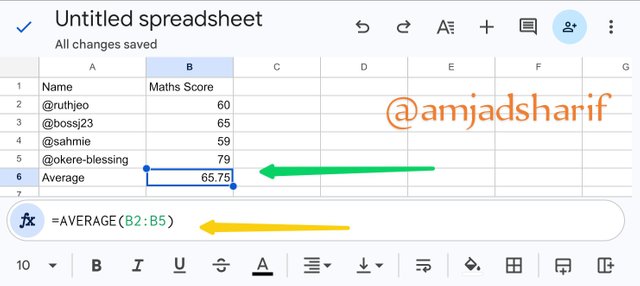
AVERAGE Function
I apply the average formula in formula bar.
- Yellow arrow indicates formula in formula bar.
- Green arrow indicates result of average.
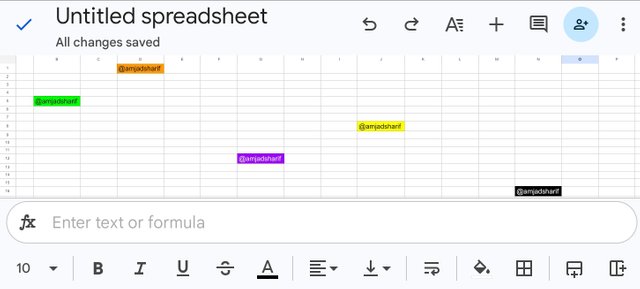
| Take a screenshot of your worksheet and identify the cell Addresses of the following; N16 with a fill color of black, J8 with a fill color of yellow B5 with a fill color of Green G12 with a fill color of purple and D1 with a fill color of orange. Write your username on these cells using a visible font. |
|---|
I filled the colors as mentioned above in the question.
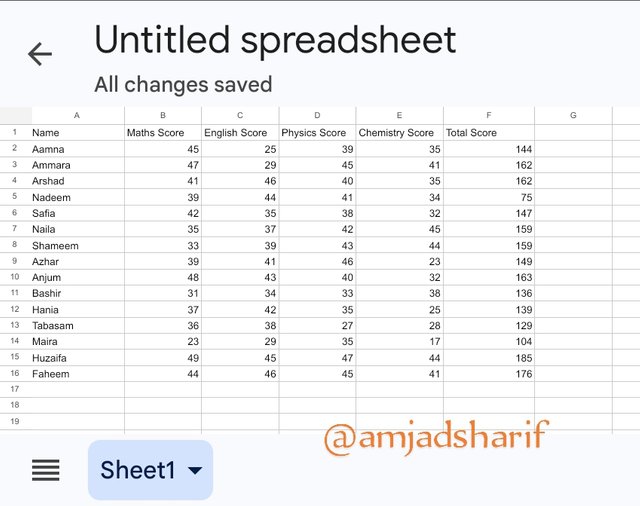
| Prepare a score for 15 students where the cell A1 label will be Name, cell B1 label will be Maths Score, cell C1 label will be English Score, cell D1 label will be Physics Score, cell E1 label will be Chemistry Score and cell F1 will be labeled Total. Add all necessary information and calculate the total for each student. Show clear working. |
|---|
In this last question I read the guideline and filled the data and apply the SUM Formula, which can be seen in the picture below.
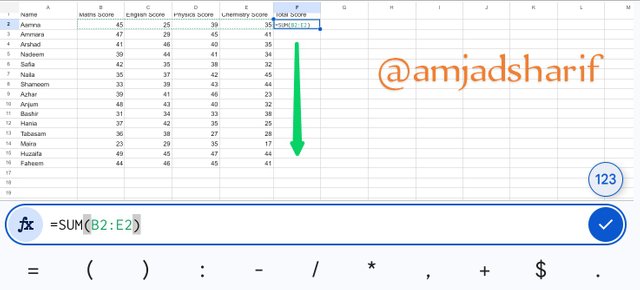
After entering the button on keyboard you can see total Sum. If you are using computer or laptop you can simple scroll down and get results but if you are on mobile you need to put formula in each cell and in the end you will got result.
In this lesson I tried to understand Google sheet on mobile and it was a good experience for me thank you.
Cc: @josepha, @simonnwigwe.
I invite some of my friends @shabbir86, @aneukpineung78, @weddi to join this contest.
All Screen shots take from mobile app spreadsheet.
Thank You

Thank you my friend for writing this awesome article. I wish you the best in life.
X promotion
https://x.com/AmjadSharifWat1/status/1835198958160707779?t=mbJDBbgrn-erk17Zci_UHQ&s=19