SEC | S20W4 | Google Sheets Features and Functionality (Creating Forms & Sheets)
SEC | S20W4 | Google Sheets Features and Functionality (Creating Forms & Sheets)
This is my homework post for Steemit Engagement Challenge Season 20 Week 4 assignment of Professor @simonnwigwe’s class, Google Sheets Features and Functionality (Creating Forms & Sheets).

Note :
- I performed this task on Windows 10 PC, Google Chrome.
Task 1 - Explain your understanding of Google Sheets and then describe in detail the various features of a Google Sheets, a pictorial representation of these features is necessary so ensure you have clear screenshots.
My Understanding of Google Sheets
Google Sheets is a spreadsheet application developed by Google. Google Sheets is web-based, so access is only possible with an internet connection. Google Sheets is part of Google Workspace. In Google Workspace, besides Google Sheets, there are several other applications that are intended to support web-based user productivity, including:
- Gmail, which is the main email system from Google, as well as the basis for the integration of all Google productivity services in Google Workspace. This means that by getting Google email (Gmail), users also automatically have access to other services in Google Workspace.
- Google Drive, a cloud-based storage where users can store their files.
- Google Docs, a document processing application, similar to Microsoft Word.
- Google Slides, a presentation application, similar to Microsoft Power Point.
- Google Meet, a popular video communication application for online video meetings.
- Google Chat, a chat application.
- And others.
The history of Google Sheet began in 2007 when Google added it along with Google Docs to Google Apps. Google Apps launched in 2006 was the forerunner of Google Workspace that we know today. Before changing its name to Google Workspace in 2020, Google Apps had been rebranded as G Suite in 2016.
Just like other Spreadheet applications, Google Sheets is an application created to store, manage and analyze data in tabular form. The cells in Google Sheets can store data in the form of numbers, text, and mathematical formulas that help users perform data analysis and mathematical operations automatically.
Various Features of Google Sheets
Similar to Microsoft's Excel spreadsheet application, Google Sheets also has many capabilities that help users record, process, and analyze data. The difference that arises is because Google Sheets is a web-based application. Here are some important features of Google Sheets:
- Formulas and Functions.
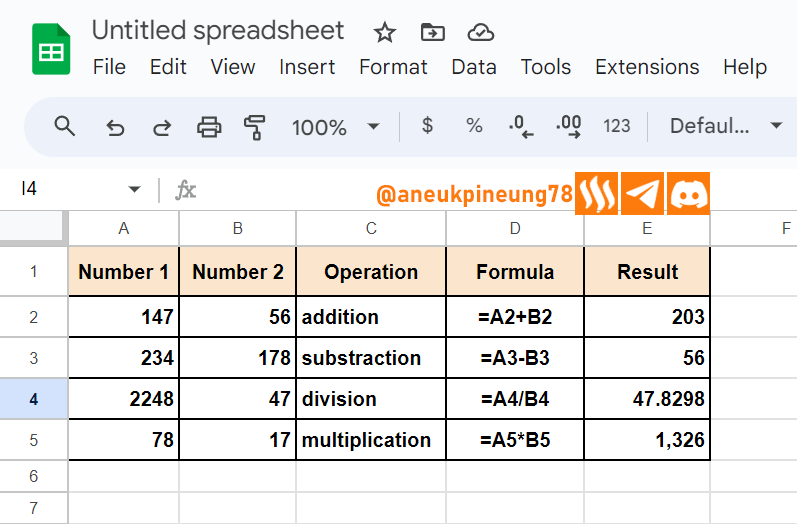
- Mathematical Formulas. Google Sheets is capable of running basic math formulas such as arithmetic (division, multiplication, subtraction, division).

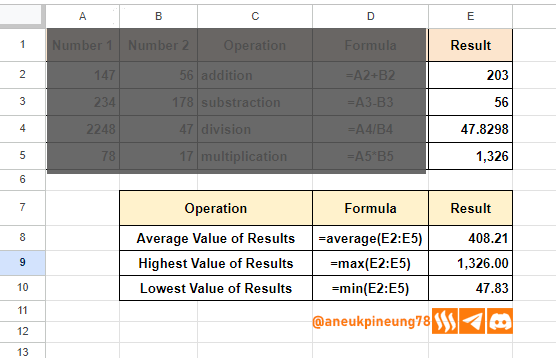
Image is clickable and might show larger resolution. - Statistical functions such as finding the average, highest, and lowest values, are also within the capabilities of Google Sheets.

Image is clickable and might show larger resolution. - Logical Function. This function is useful in decisions making based on certain circumstances.
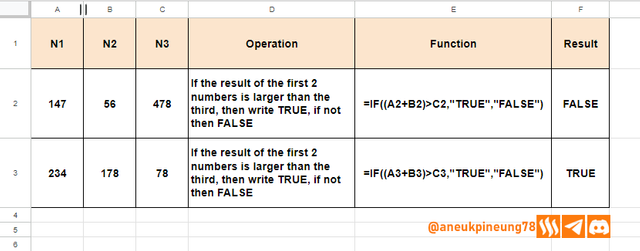
Image is clickable and might show larger resolution. - Text Functions. Not only numbers, Google Sheets can also process text such as combining words, changing letters to ALL CAPS or lowercase.
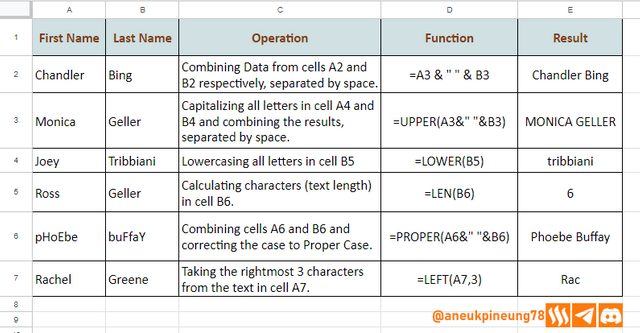
Image is clickable and might show larger resolution.
- Mathematical Formulas. Google Sheets is capable of running basic math formulas such as arithmetic (division, multiplication, subtraction, division).
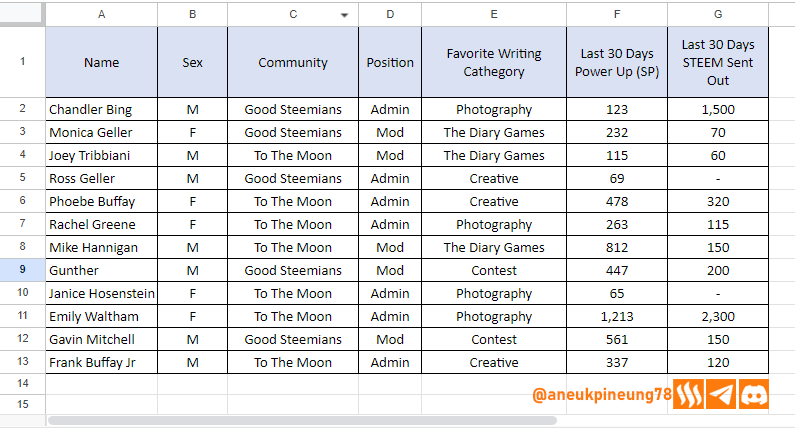
- Filter. Sometimes users want to get rid of those complex data and want to see some less complex version, comes Filter which is able to help filter the data users want to display. Let’s say I have this table.
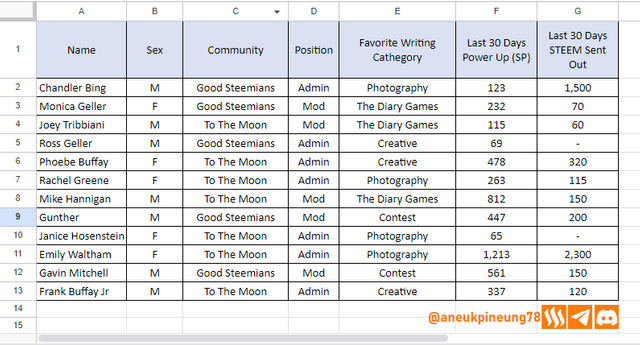
Image is clickable and might show larger resolution.
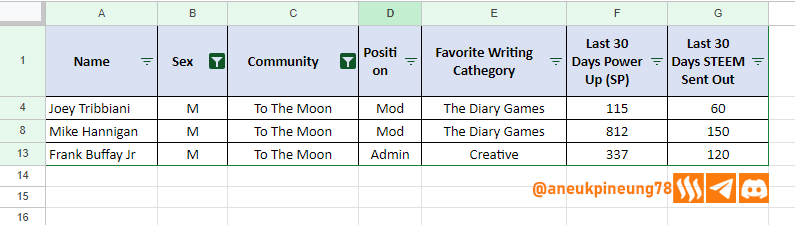
Now I want the table to show only data related to male (M) members from To The Moon Community. So I use the filter on this two categories. The result is seen in the below image.
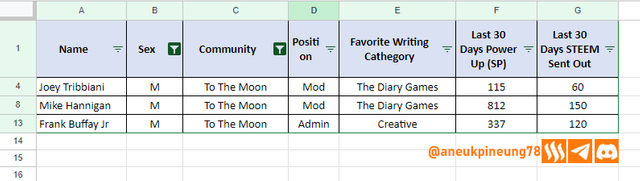
Image is clickable and might show larger resolution. - Sort. A feature that helps sort data, usually useful in ranking by value or alphabetically. Example: the same table we used before, I want it to show data based on the highest to lowest ranking of last 30 days total SP powered up of each member, the result is as seen below.
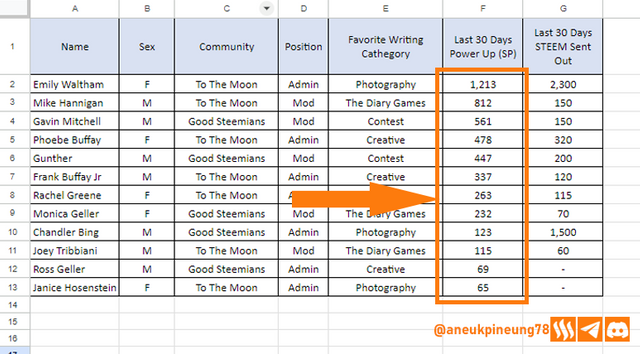
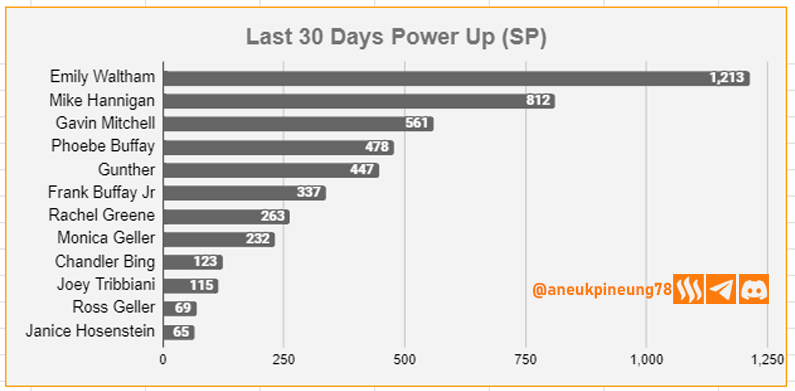
Image is clickable and might show larger resolution. - Graphic or Chart. Visualizing alphanumeric data with graphics or charts makes presentations and reports more interesting and easier to understand. Still using the same table, now I convert the alphanumeric data of the last 30 days total SP powered up into chart, I use the bar chart, the result is as seen below.

Image is clickable and might show larger resolution. - Pivot Table. Just like Microsoft Excel, the Pivot Table in Google Sheets is a powerful tool for processing large data and analyzing it and generating informative summaries based on the type of information and display that the user wants to generate. Still with the same table, I want the table to show me only the data of the number of favourite writing category uploaded to each of community, the table should also display the information of the total number of articles in each category and the grand total number of all category. Here is the result:
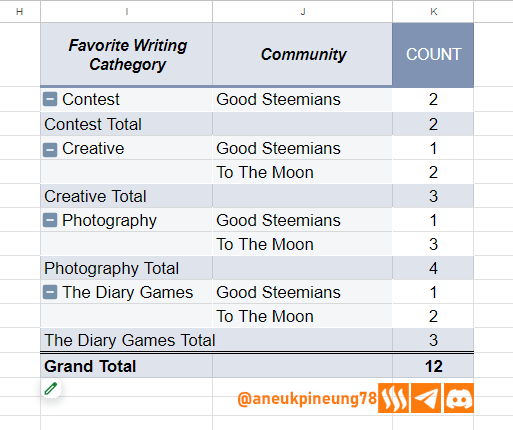
Image is clickable and might show larger resolution. - Collaboration. The luxury offered by web-based applications is that people can access from anywhere, and Google Workspace has collaboration functions including working together at the same time, including in Google Sheets. So, it's as if there's no distance anymore even if everyone is far away.
- And others.


Task 2 - Create a simple Google form with the title Google Sheets 101 and use all the question types such as (Multiple choice, Short answer, Paragraph, Checkbox, Dropdown, etc) format to create your desired questions in the form. Customize all questions to be required and add a banner at the heading of your form. Clear screenshots are needed for this task.
Creating Questionnaire
- Google Sheets can be accessed via the Google Apps button in Google Chrome and can be used if you are logged into your Google account. Google Sheets can also be accessed by typing the link https://docs.google.com/forms/u/0/ into the browser. This time I accessed via the Google Apps button in the Google Chrome browser because I thought it was the easiest way. Firstly I clicked the Google Apps button (shown is the below picture by the pointer 1), then a dropdown window containing list of Google Apps in the Google Worspace, I scrolled down and searched for Google Forms button and clicked on it.
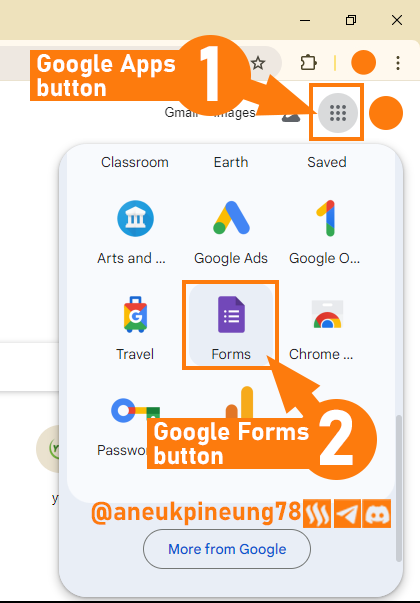
Image is clickable and might show larger resolution. - In the nexrt window I chose [Blank form].
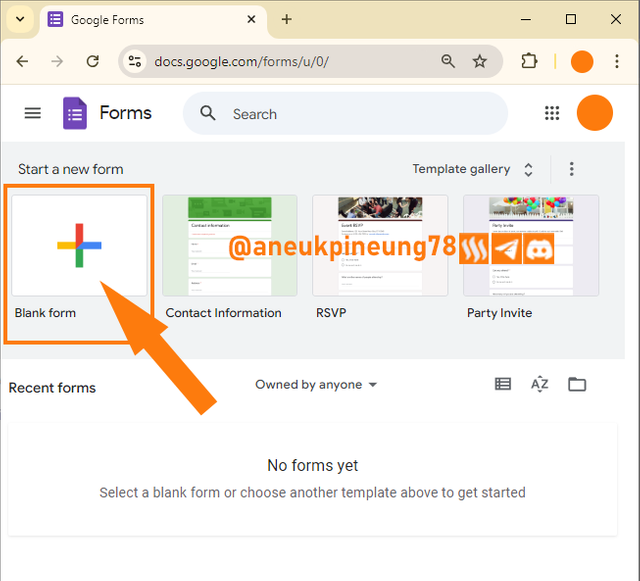
Image is clickable and might show larger resolution. - The blank form window was opened.
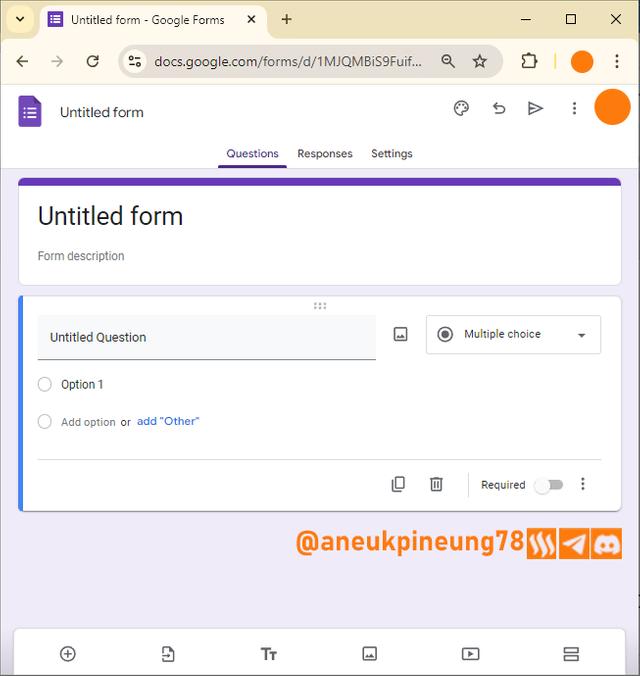
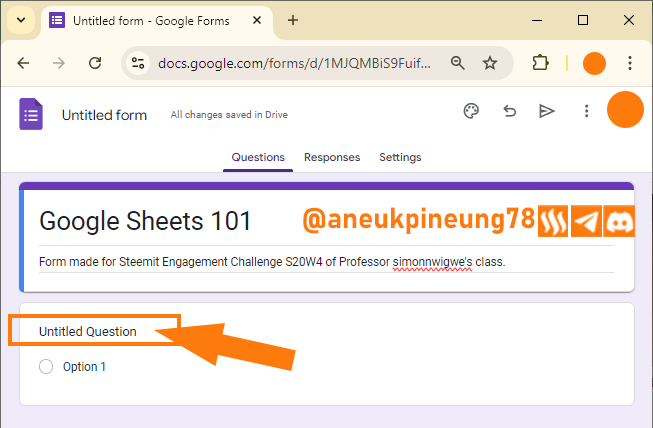
Image is clickable and might show larger resolution. - I named the form and filled in the description.
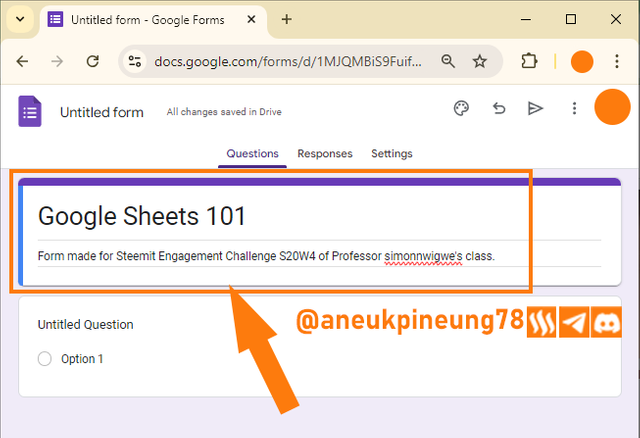
Image is clickable and might show larger resolution. - Time for Question 1. I clicked on [
Untitled Question] button to activate it.
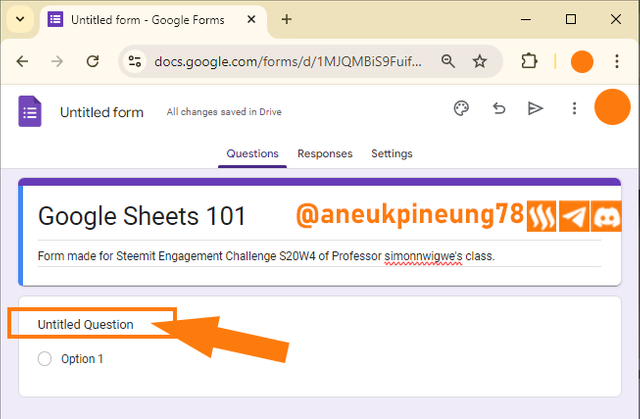
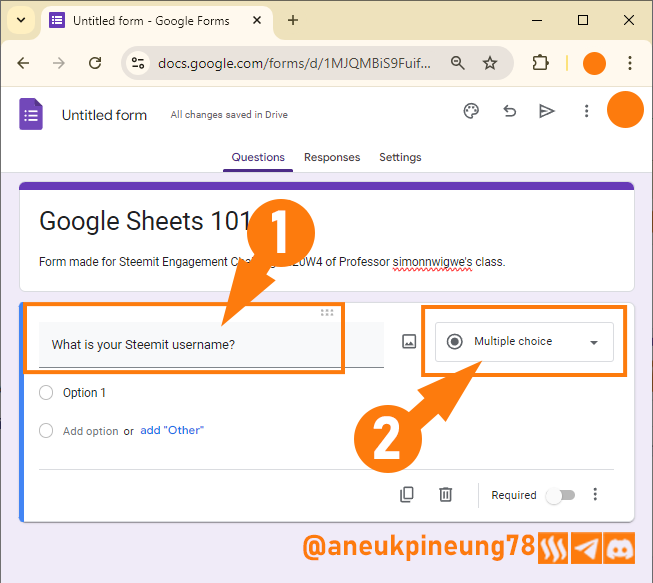
Image is clickable and might show larger resolution. - I wrote my first question, and then I hit the [Answer Category] button to change its type.

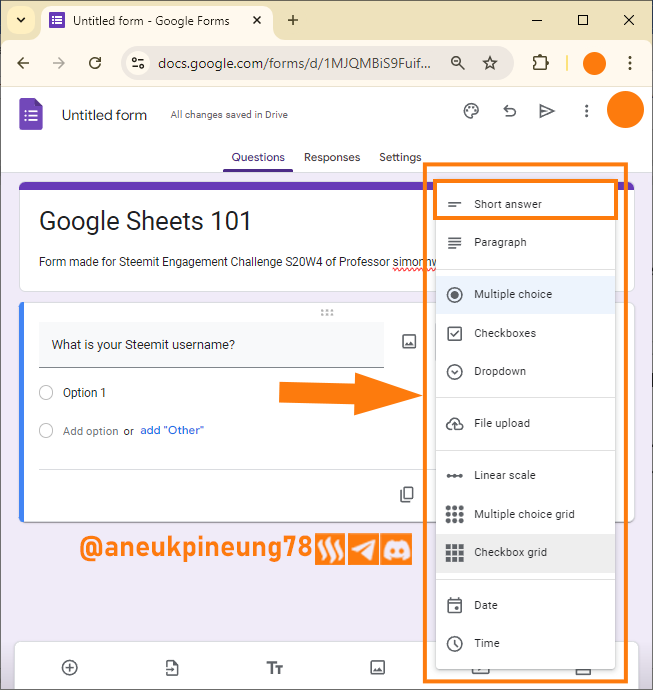
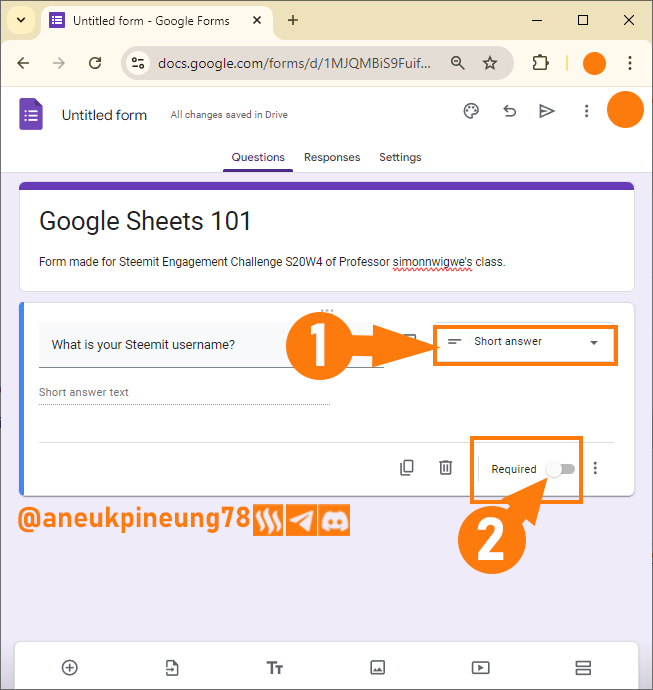
Image is clickable and might show larger resolution. - A dialogue box appeared where I can choose the question type for particular question, showing that there are 11 types of answer available. This types will determine the way the users answer the questionnaire. I set the first question to be answered with short answer. Short answer is placed on the topmost of the dialog box.
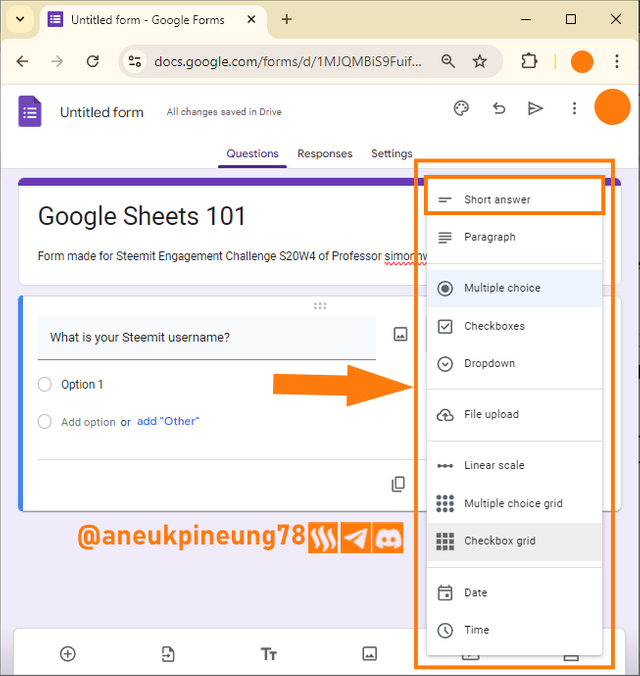
Image is clickable and might show larger resolution. - The question type was set to Short answer (pointer (1)) di the below image. The next step was setting the question as required to be answer. I hit the required button (pointer (2)) to activate it.
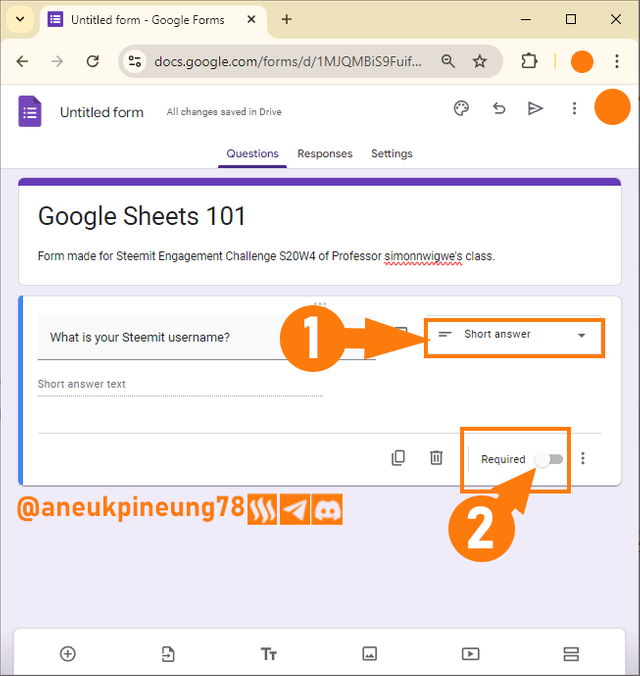
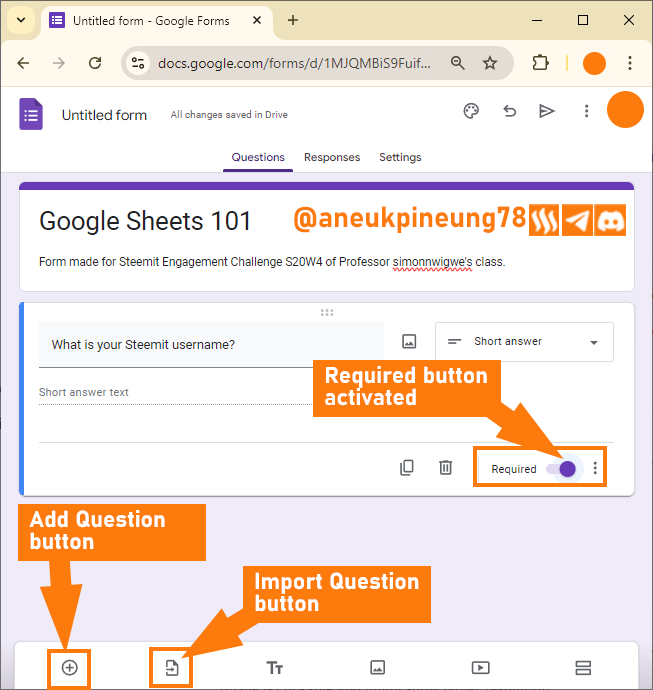
Image is clickable and might show larger resolution. - The required button was activated. Time to add another question. This can be done in two ways: 1) type another question the same way question one was created; or 2) import question if there is another form that has relevant question(s). In this case I chose the first method (add question).

Image is clickable and might show larger resolution. - The new add question dialogue box appeared. The entire process is the same with the first question: type the question, set the question type, set the requirement nature.
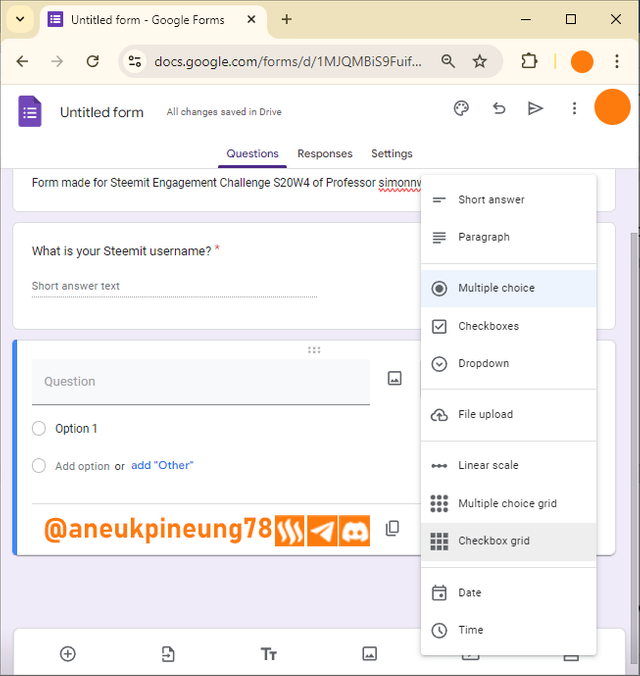
Image is clickable and might show larger resolution. - If the question type is short answer or paragraph, then the users will have to type their answers. Paragraph type is needed for long answer, like when we want users to write their opinions in 300 words or more. While, if it is multiple coice or checkboxes or dropdown, we will need to provide options for the users to choose. Below is the example for the paragraph question type.
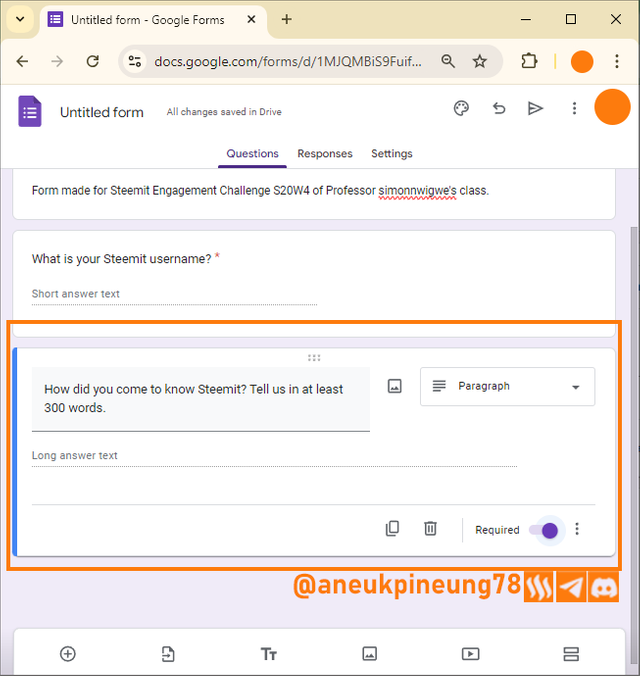
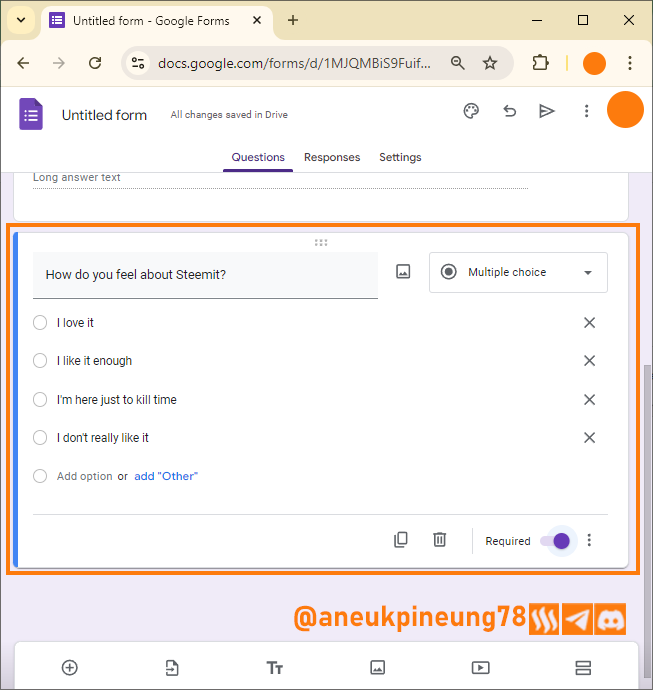
Image is clickable and might show larger resolution. - Multiple choice question type:
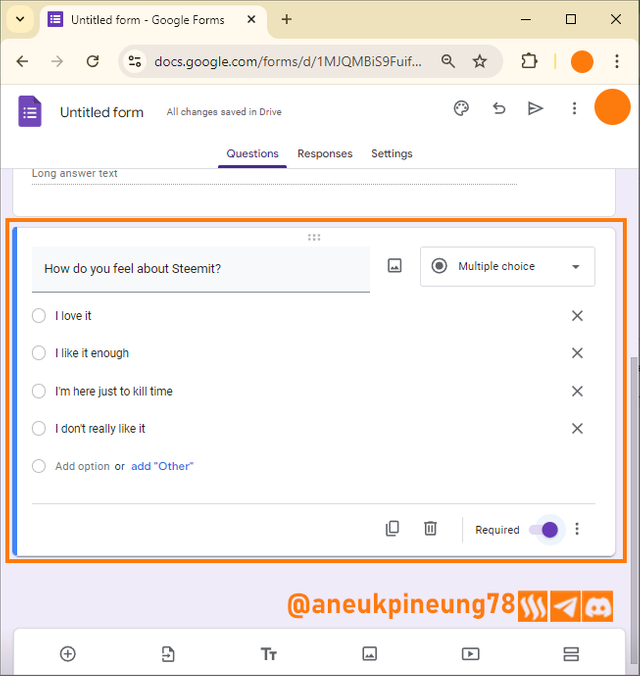
Image is clickable and might show larger resolution.


Adding Banner
- First, I hit the Customize Theme button.
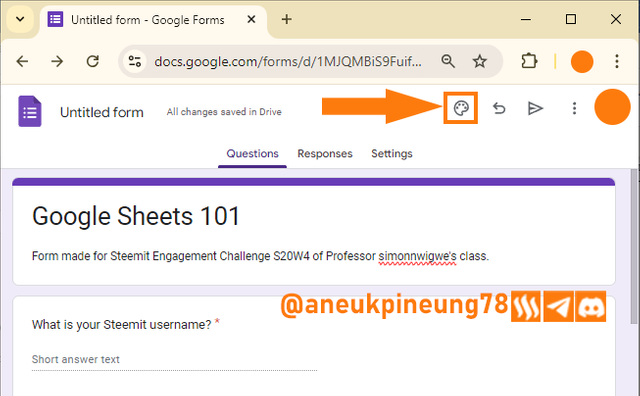
Image is clickable and might show larger resolution. - In the dialogue box that followed, I hit the [Choose image] button.
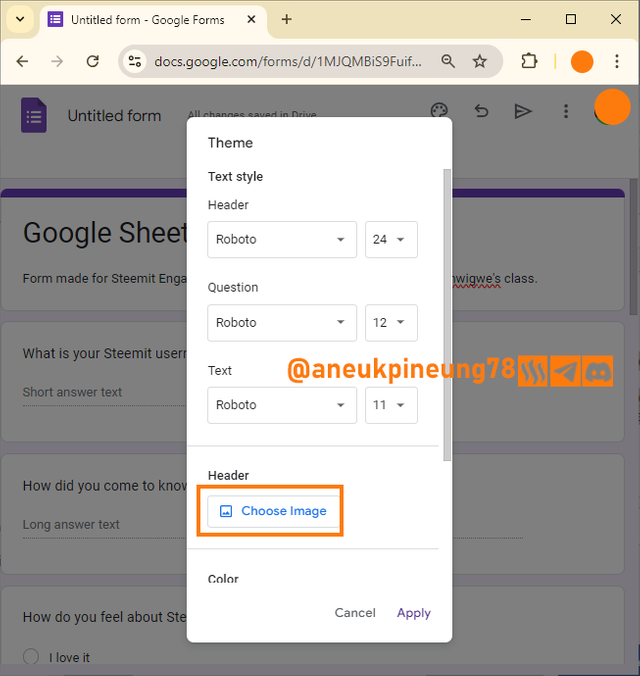
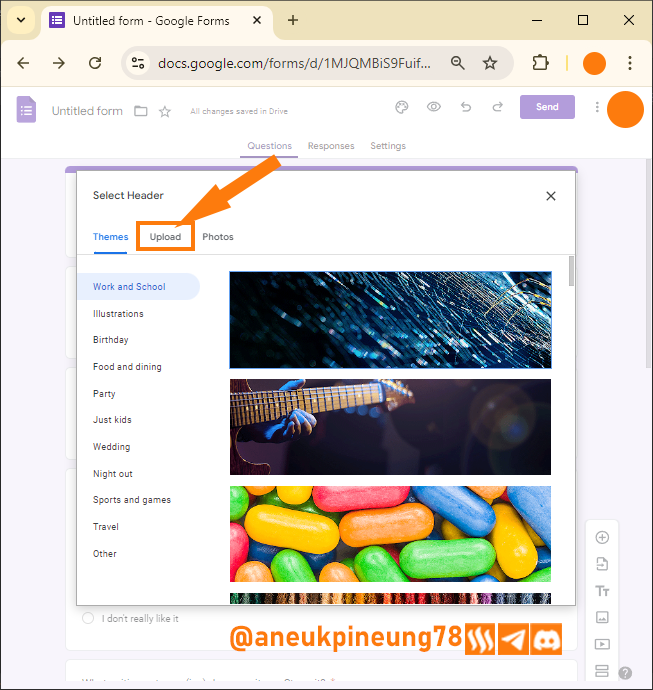
Image is clickable and might show larger resolution. - Google has provided many free images that can be used instantly for banners. But I wanted to use my own image, so I pressed the [Upload] button.

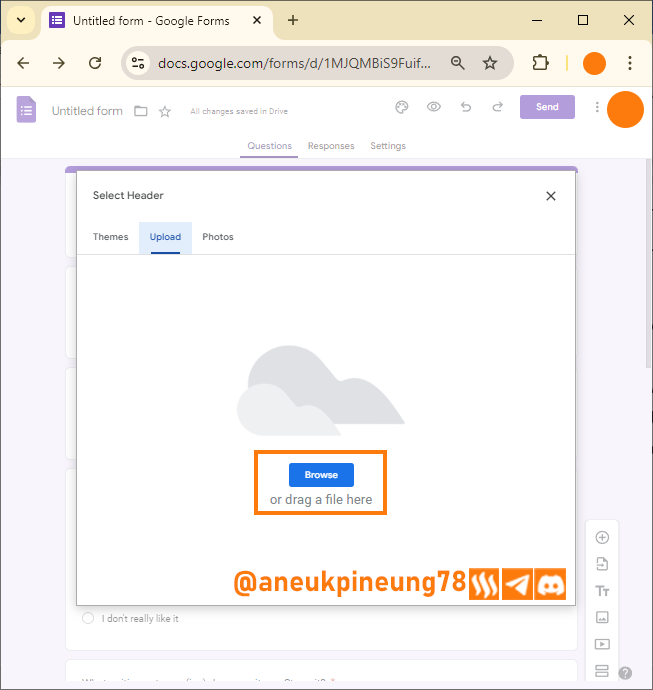
Image is clickable and might show larger resolution. - I pressed the [Browse] button and searched for my image in my PC storage.

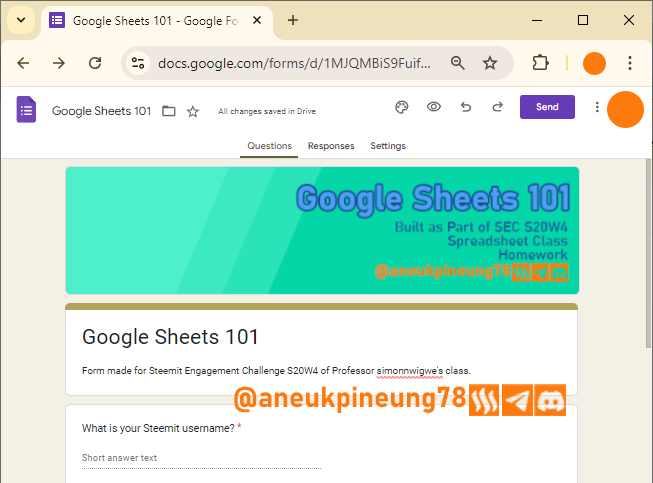
Image is clickable and might show larger resolution. - Now the form has its banner.

Image is clickable and might show larger resolution.


Sending the Finalize Form
Once the form is ready, comes the time to send it to potential respondents.
- I pressed the [Send] button.
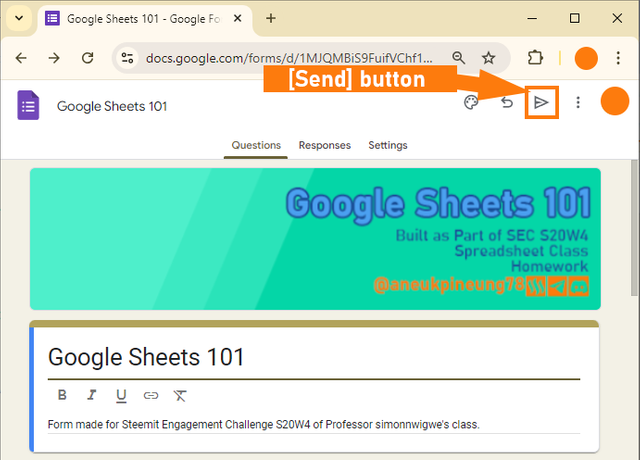
Image is clickable and might show larger resolution. - There are 3 ways to share the form:
- via Email, the form owner invites potential respondents by sending an email;
- Link, this way the form owner shares a link to the form with potential respondents, similar to email but this way has more possibilities of distributing the form: via messaging applications or via blogs (or websites), or even in printed formats such as flyers.
- Embedded HTML. This method runs on a web-based interface that is capable of running HTML codes. However, this is not possible for forms that contain questions or instructions for potential respondents to upload files.
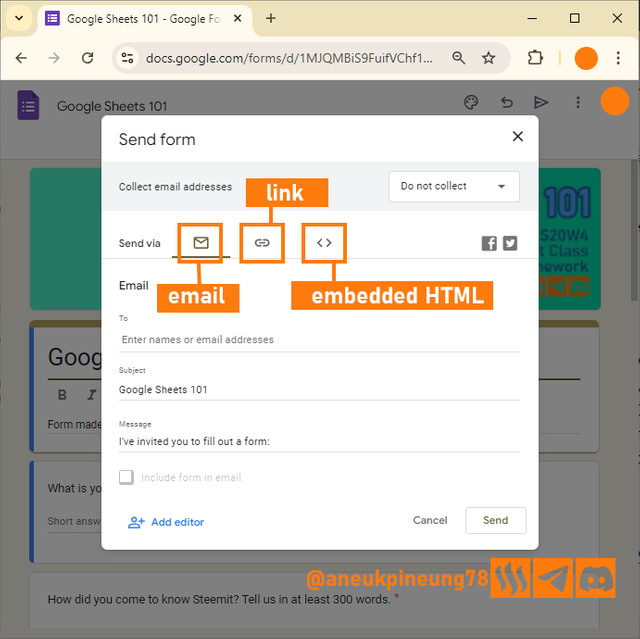
Image is clickable and might show larger resolution.
- I chose to share this form through a link. There is even a link to directly share it via Facebook or Twitter (X). I utilized the Shorten URL feature so that the link I will share has a simpler structure. I clicked [Copy] button.
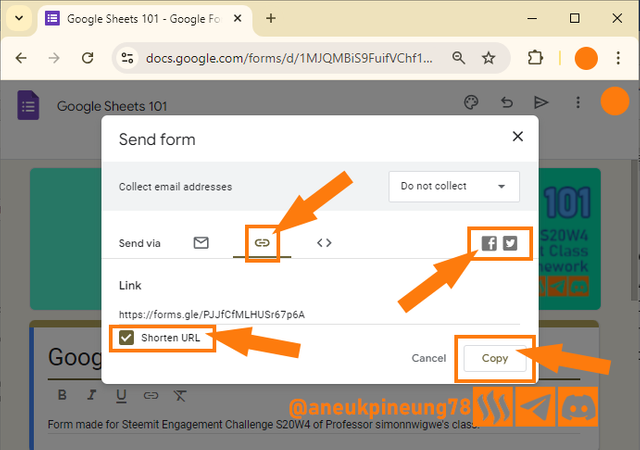
Image is clickable and might show larger resolution.


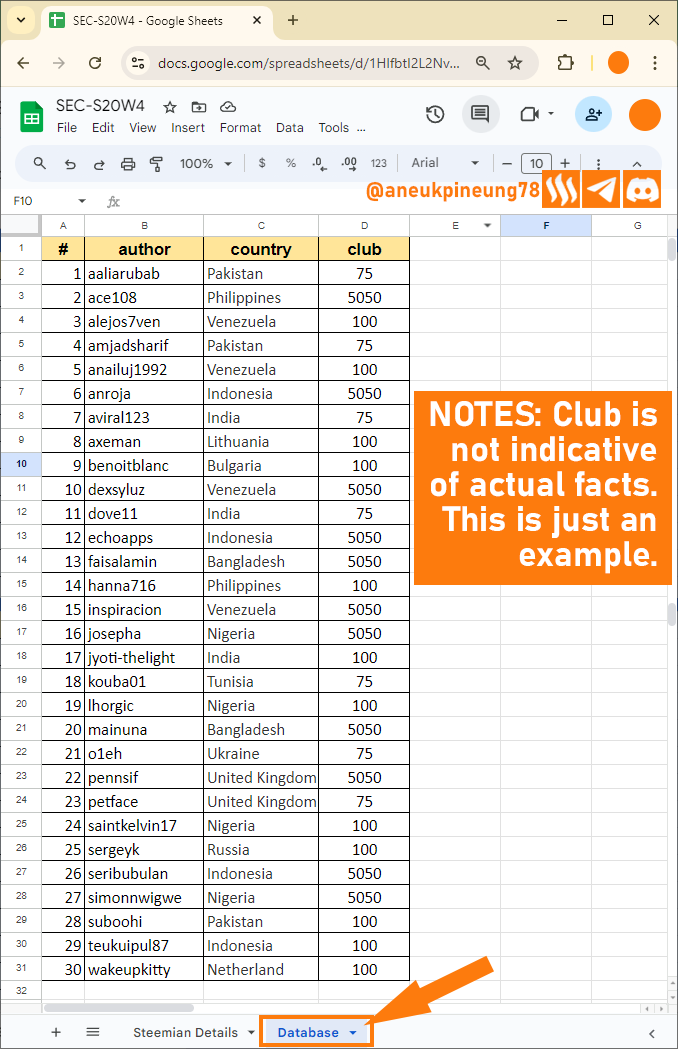
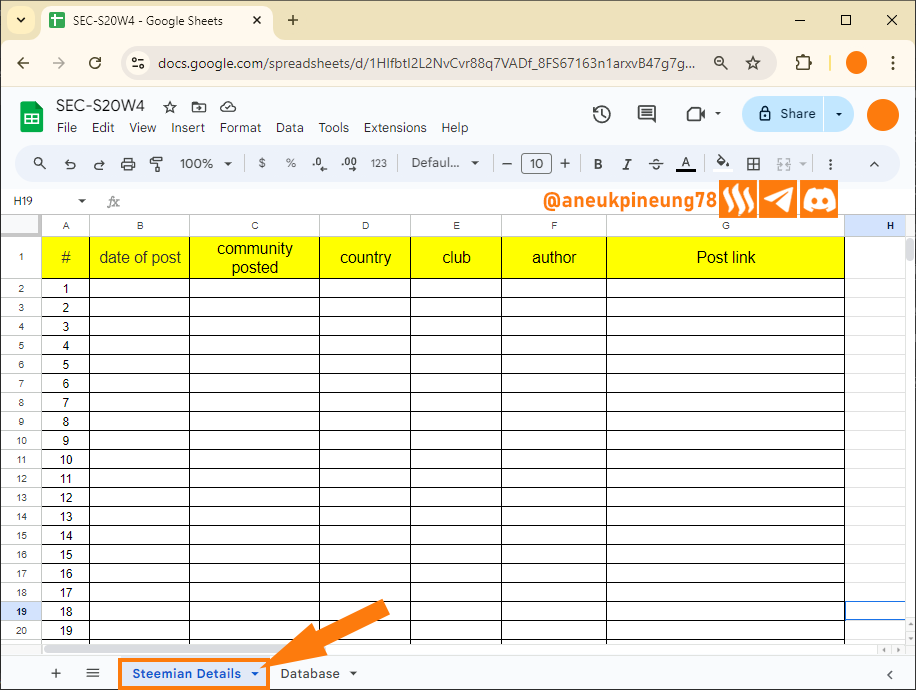
Task 3 - Create a Google sheet titled SEC-S20W4 with two pages, the first page will be called Steemian Details and it should include the date of post, community posted, country, club, author, and Post link and the next page should be called Database. Your database should have author, country, and club so that when a post link is dropped in the Steemian details it can fetch the details automatically. (Ensure that your database has at least 30 Steemians and the same goes with the post link). Clear screenshots are needed for this task.
- In the same way that I created a Google Form, I select Google Sheets in the Google Apps dialogue box.
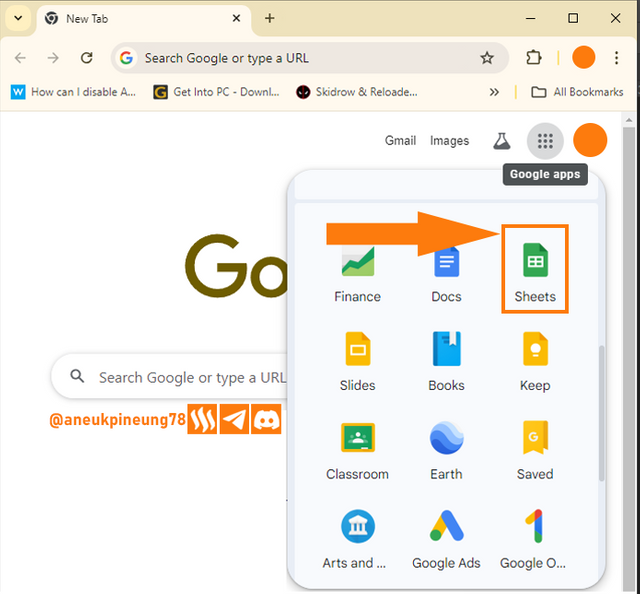
Image is clickable and might show larger resolution. - I chose Blank spreadsheet.
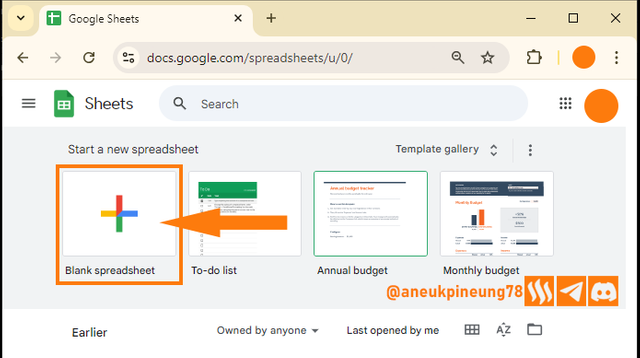
Image is clickable and might show larger resolution. - I named the Spreadsheet and create two Sheets: Steemian Details and Database.
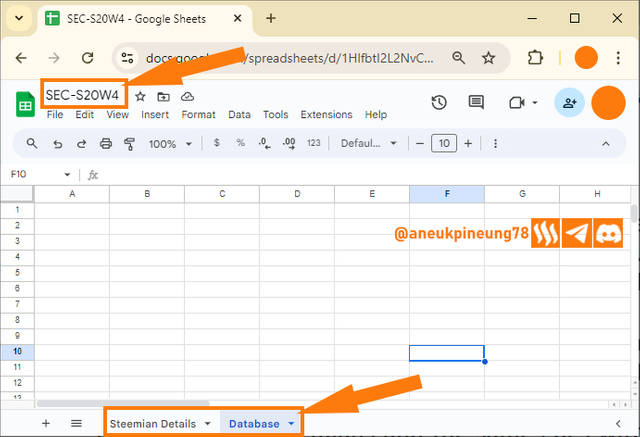
Image is clickable and might show larger resolution. - I filled in data in the Database sheet.

Image is clickable and might show larger resolution. - I prepared the table in Steemian Details sheet. This was how the sheet looked like. There was 6 columns and 30 rows to fill. Only columns Date of Post (B) and Post Link (G) will need to be filled manually, the rest will find their own values in the Database sheet, based on the link that will be filled in the Post Link column. So, the systematic work is:
- User fills in the data in the Post Link and Date of Post columns;
- The Author (F) and Community Posted (C) columns will look for their values in the Database sheet based on the data entered in the Post Link column.
- The Country (D) and Club (E) columns will look up their values based on the data from the Author (F) column.

Image is clickable and might show larger resolution.
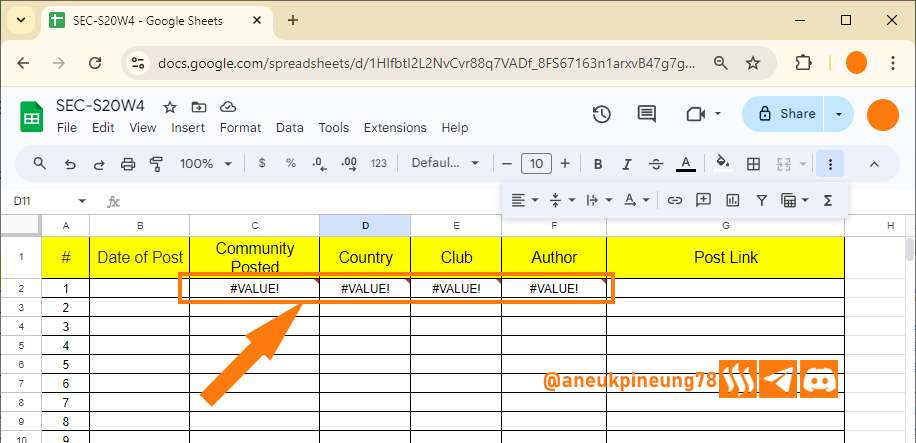
- Next, I prepare the formulas for the four columns that will fill the values automatically. For the data in cell G2 that will be referenced by other cells, then here is the formula list for each other cell in row 2 (the row will adjust itself):
- Author (F2):
=MID(G2,FIND(“@”,G2) + 1,FIND(CHAR(160),SUBSTITUTE(G2,“/”,CHAR(160),5)) - 1 - (FIND(“@”,G2)))
This formula contains the command that cell F2 searches for the string of characters after the “@” character in cell G2 and writes down its findings to the limit of the the first “/” character after it but does not write down “/”. - Club(E2):
=index(Database!$D$2:$D$31,match(F2,Database!$B$2:$B$31,0))
This formula asks cell E2 to find the value in the Database sheet based on the value of cell F2 in the Steemian Details sheet. - Country (D2):
=INDEX(Database!$C$2:$C$31,MATCH(F2,Database!$B$2:$B$31,0))
This formula asks cell D2 to find the value in the Database sheet based on the value of cell F2 in the Steemian Details sheet. - Community Posted (C2):
=MID(G2, FIND(“/”, G2, FIND(“/”, G2, FIND(“/”, G2) + 1) + 1) + 1, FIND(“/”, G2, FIND(“/”, G2, FIND(“/”, G2, FIND(“/”, G2) + 1) + 1) + 1) - FIND(“/”, G2, FIND(“/”, G2, FIND(“/”, G2) + 1) + 1) - 1)
This formula contains a command for cell C2 to find its value in cell G2 on the same sheet, the value to find must be located after the third “/” character and before the fourth “/” character.
The following image shows the situation when all the corresponding cells in row 2 have been assigned formulas, but the column (G) that is the reference in row (2) has no value (data) yet.
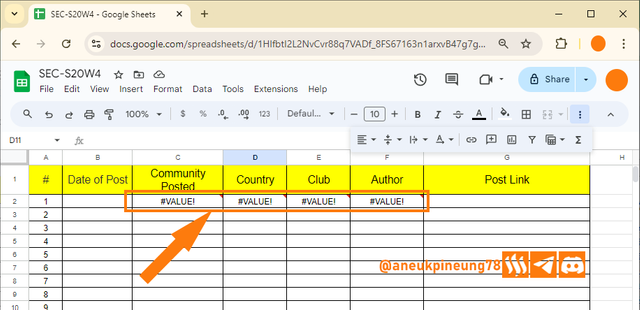
Image is clickable and might show larger resolution.
- Author (F2):
- I entered the first data in cell G2 which will be the reference for the corresponding cells in the same row. Here's the result.
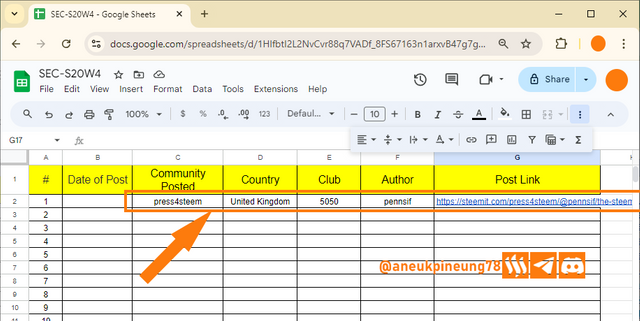
Image is clickable and might show larger resolution. - So, I thought those formulas have worked well. I then duplicated them to the rest of the needed cells. The image below shows the result.
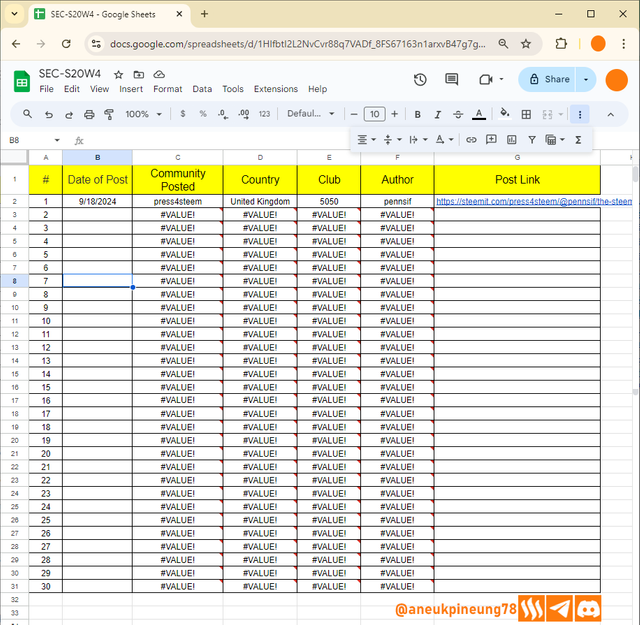
Image is clickable and might show larger resolution. - I filled in the rest of the required data.
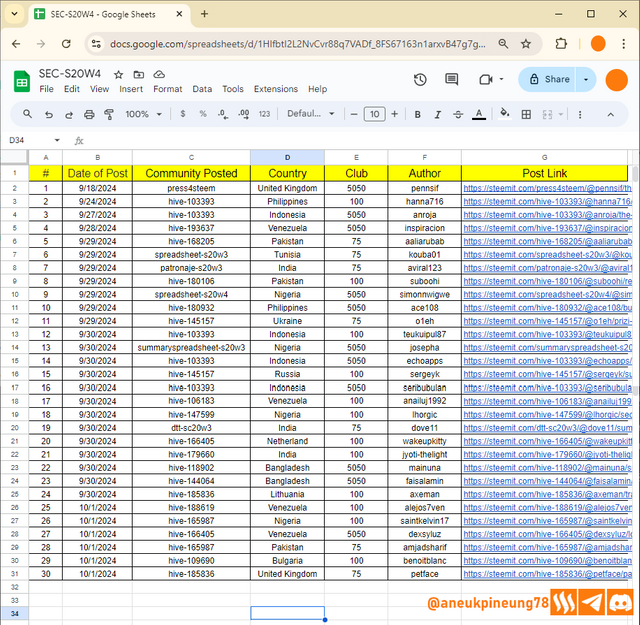
Image is clickable and might show larger resolution.


Task 4 - Using atleast pie chart & bar chart, show us the relationship between author and country as contained in the above question.
Preparing The Table
The two tables we have in the SEC-S20W4 Spreadsheet are not the type of power that can be directly made into charts. So we must first process them into other tables that are suitable for chart processing. Using the tables in the previous task, to create a chart that shows the relationship between author and country, there are two possible scenarios that can occur:
- based on the table in the Diagram sheet;
- based on the table in the Stemians Details sheet.
Both tables may have the same data, and therefore the same charts. But in the Steemian Details table, an author can have more than one post link, so from that table you can make a “Relationship Between Country and Number of Posts” chart, while from the table in the Database sheet, “Relationship Between Country and Author”. In this case, since each Author mentioned in the Database sheet has 1 post each in my table in the Steemian Details sheet in the previous task, the two charts will not be different.
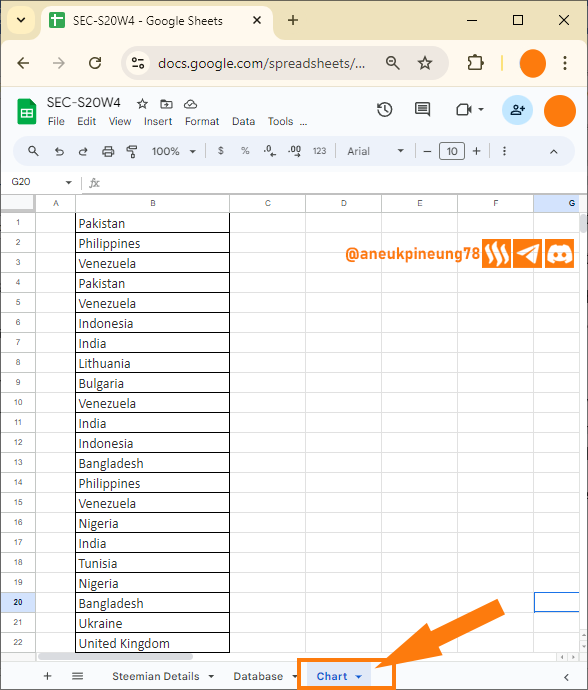
- What to do first? Create a new table that shows the number of articles from each country. I copied the country data into a new sheet that I named “Chart”.

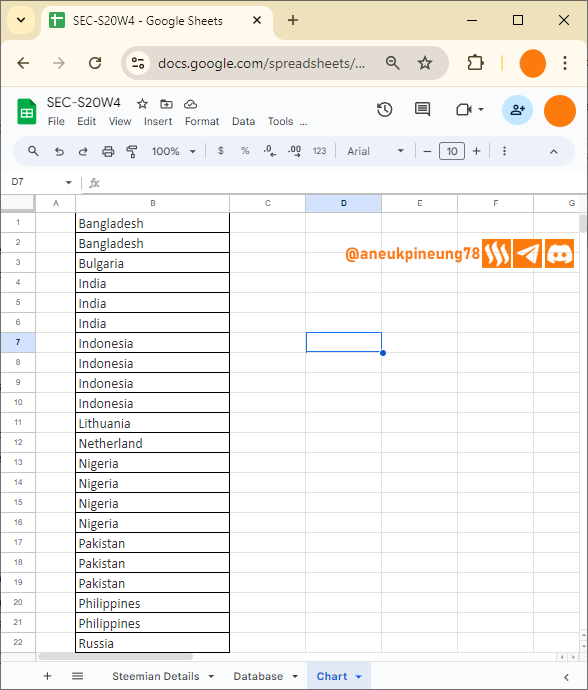
Image is clickable and might show larger resolution. - I then sorted the data in an A-Z pattern.
- Block the data to sort.
- Go to [Data] > [Sort range] > [Sort (A-Z)]
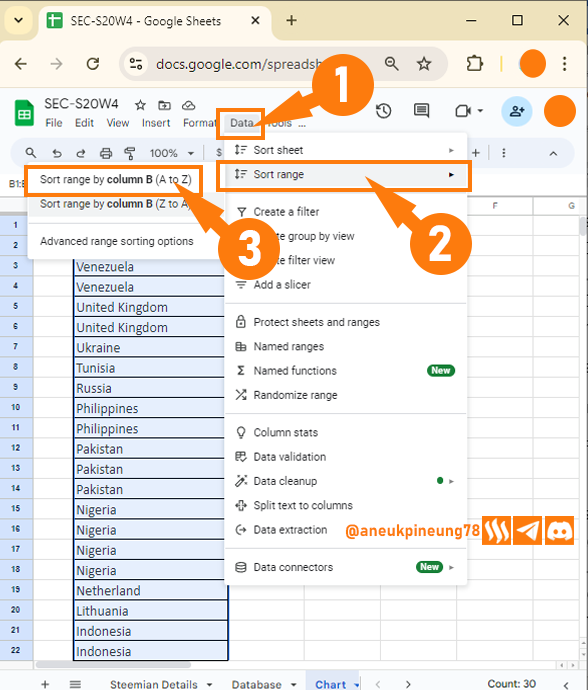
Image is clickable and might show larger resolution.
The result:

Image is clickable and might show larger resolution.
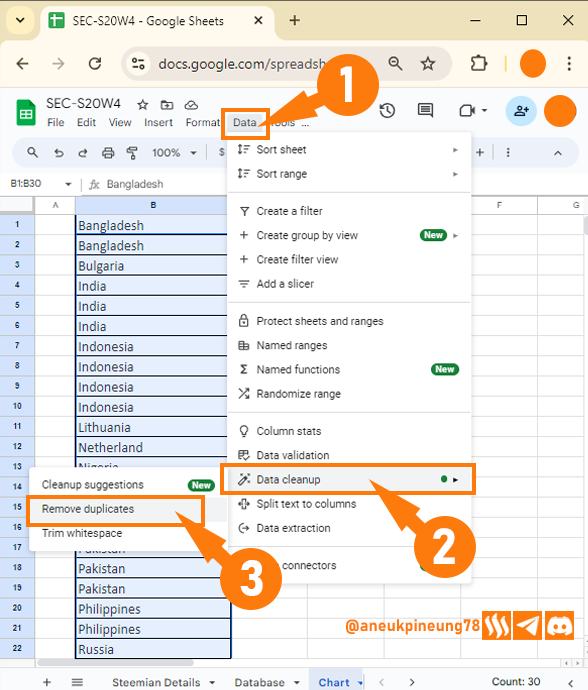
- Next step: removing duplictes.
- Block the data to “clean”.
- Go to [Data] > [Data cleanup] > [Remove duplicates]

Image is clickable and might show larger resolution.
- I added header and the “Number of Post” column to the right.
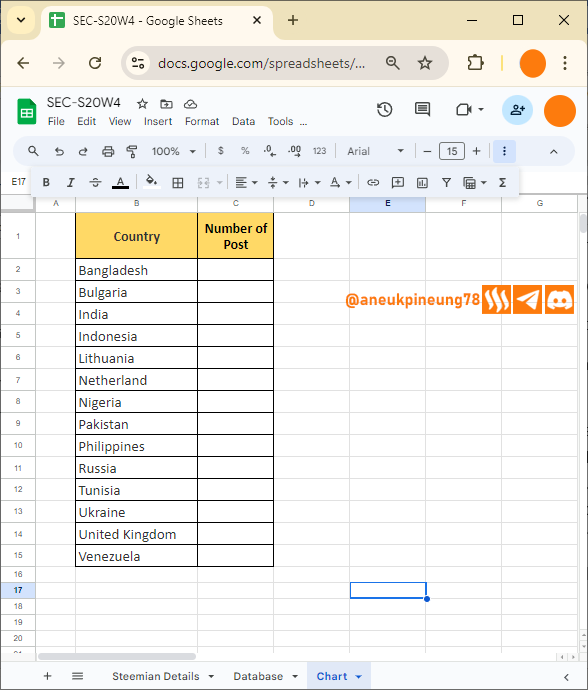
Image is clickable and might show larger resolution. - Time to generate the result of number of post per country. I obtained the data form Database sheet. The formula I used was
COUNTIF. On cell D2, the formula was:
=countif(Database!$C$2:$C$31,B2)
The formula contains a command to analyze the range of column C from cell 2 to cell 31 in the Database sheet (where the county list is available), and then count how many have the same value as the value in cell B2. The result:
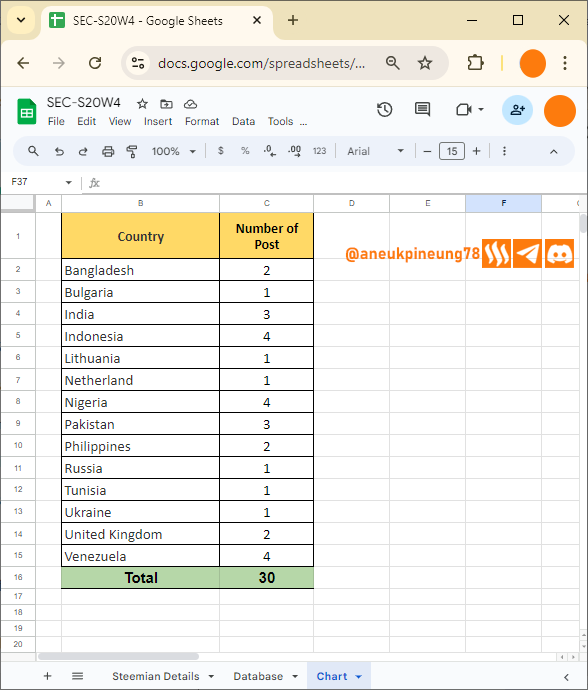
Image is clickable and might show larger resolution.


Generating the Charts
Now we have the right table, time to generate the charts.
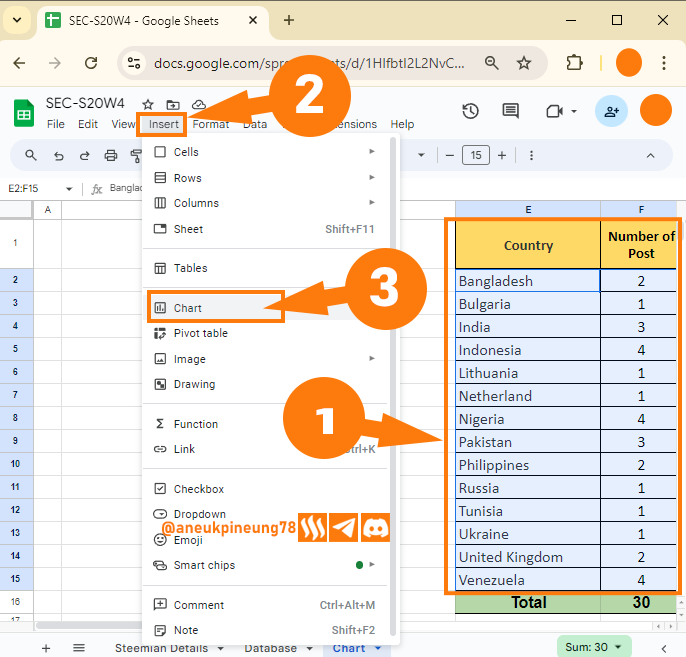
- Generating First Chart. Select data including Header. Go to [Insert] > [Chart]
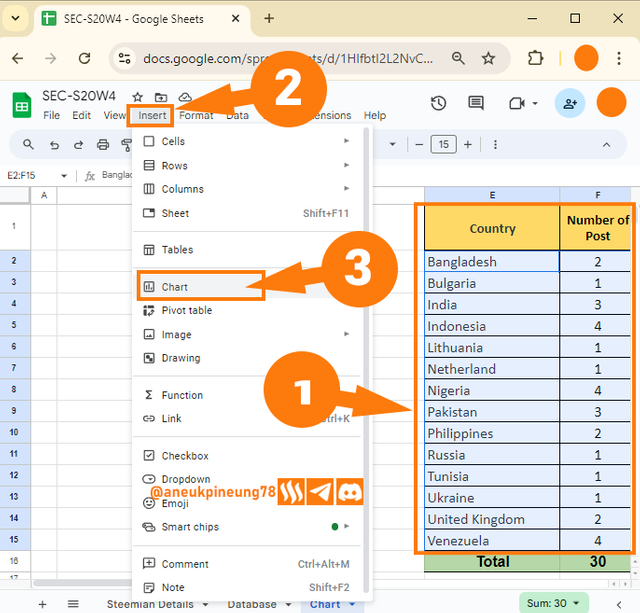
Image is clickable and might show larger resolution.
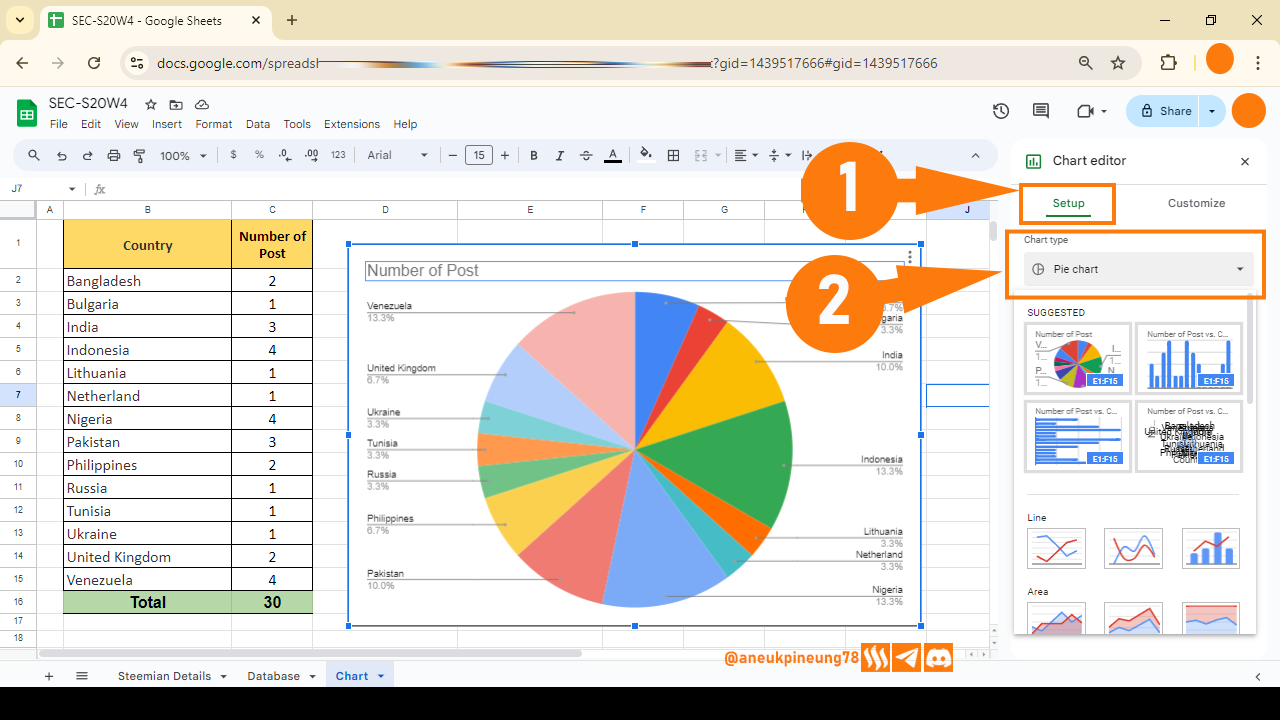
By default, the chart that appears is a pie chart.
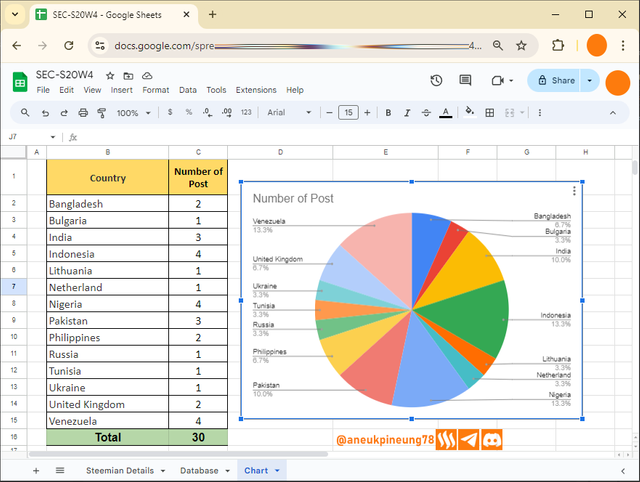
Image is clickable and might show larger resolution. - Changing Chart Type. The chart type can be changed through the settings.
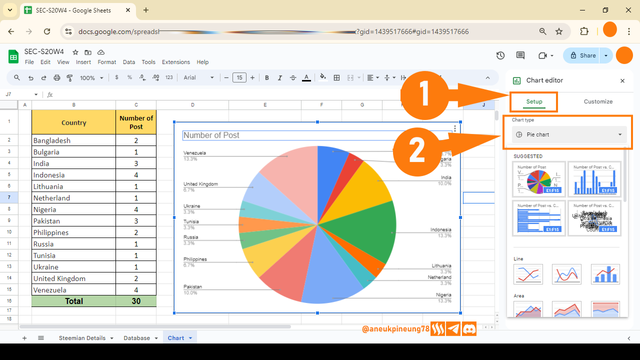
Image is clickable and might show larger resolution. - The Resulting Two Charts
Here are the pie and bar charts of the same data.
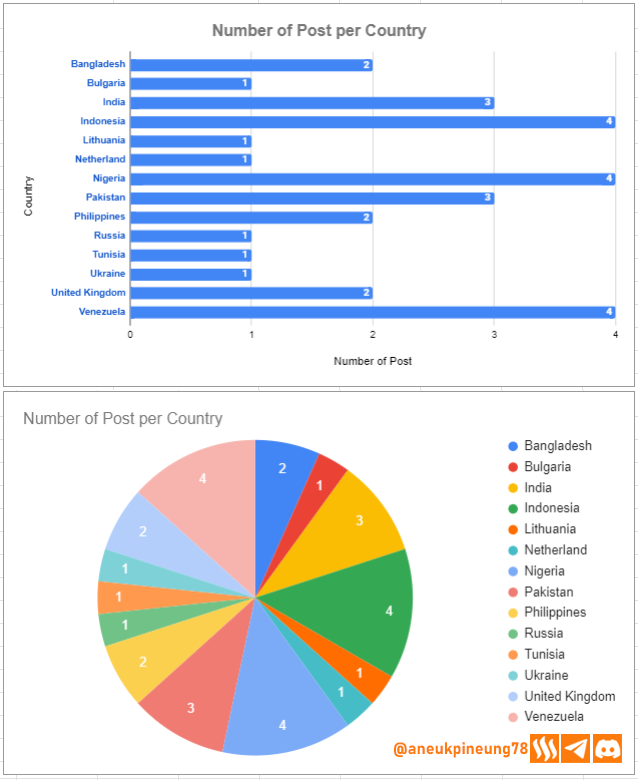
Image is clickable and might show larger resolution.


Task 5 - Attach the Link to the form and sheet and give access only to the following emails so that we can see your work properly: [email protected], [email protected].
By default, Google Sheets and Google Forms do not have the ability to limit potential respondents based on certain emails, but this can be done by utilizing Google Apps Script, but this requires coding skills, so not everyone can do it.
Sending Links via Email
The most common and easiest is to send Google Forms and Google Sheets links only to certain emails. Here's how:
- Send Google Forms link to a Specific Email
- Press the [Send] button;
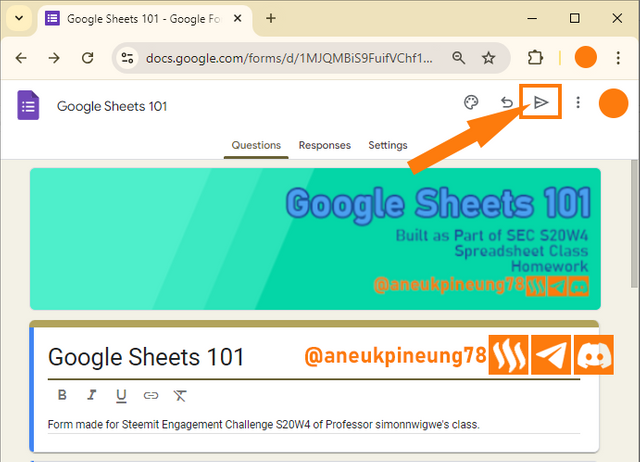
Image is clickable and might show larger resolution. - Select Email. Fill in the email addresses. Click the [Send] button.

Image is clickable and might show larger resolution.
- Press the [Send] button;
- Send Google Sheets link to a Specific Email
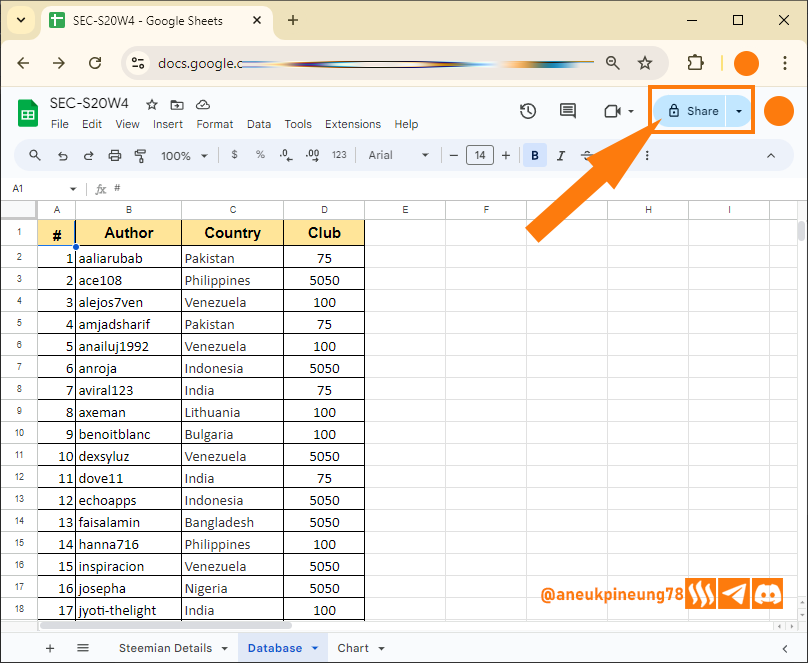
- Press the [Share] button;
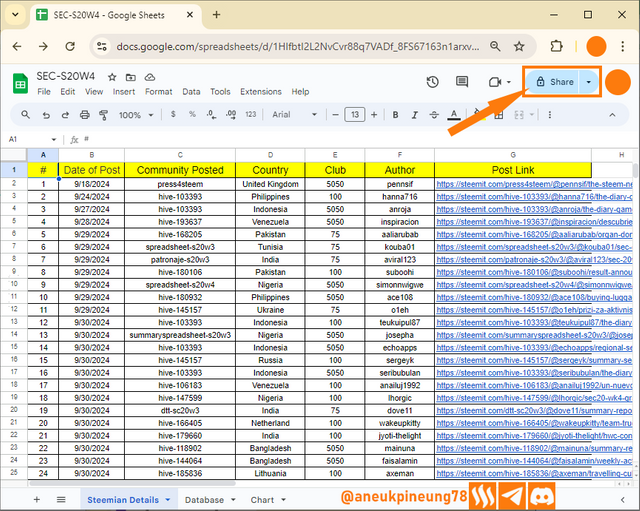
Image is clickable and might show larger resolution. - Fill in the email addresses and message. Click the [Send] button.
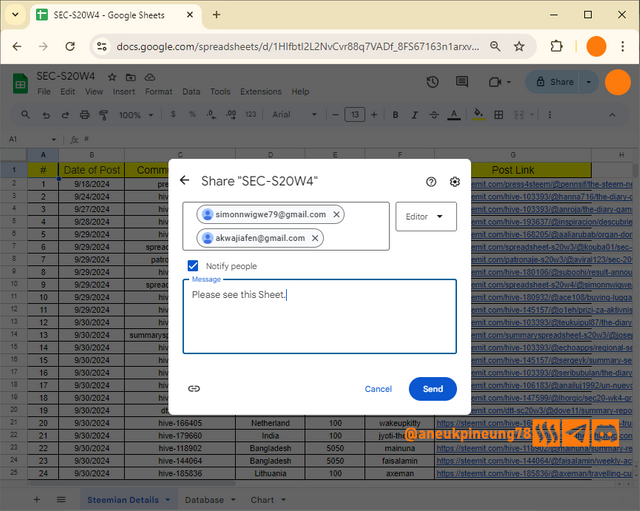
Image is clickable and might show larger resolution.
- Press the [Share] button;


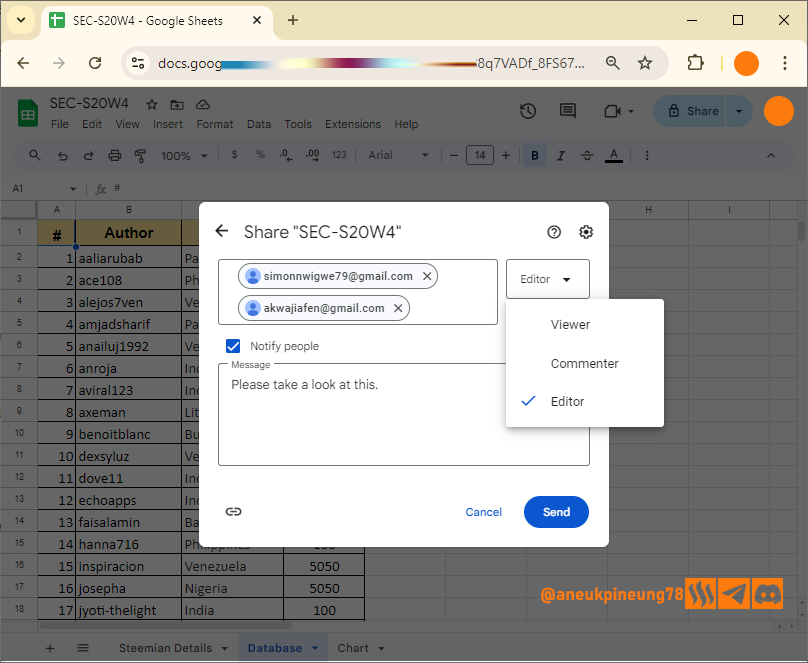
Adding Collaborators
Or, there is option to add Collaborators to Google Sheets and Google Form. However, there are differences in the roles and capabilities of collaborators in Google Sheets and Google Form. In Google Sheets, collaborators can be given one of 3 types of titles: 1) Viewer (can only view the Sheet); 2) Commenter (can add comments to the Sheet), and 3) Editor (can edit the Sheet) then in Google Form, there is only one title that can be given to collaborators which is Editor (has the ability to read and delete responses).
- Adding Collaborators to Google Sheets
- Click the [Share] button.
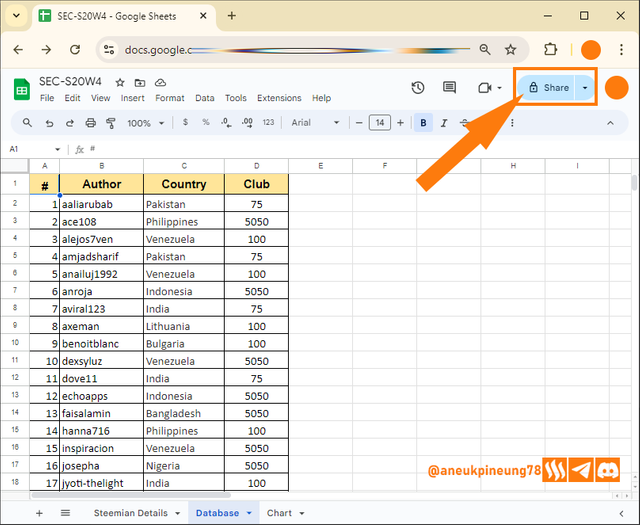
Image is clickable and might show larger resolution. - Fill the email addresses in the box.
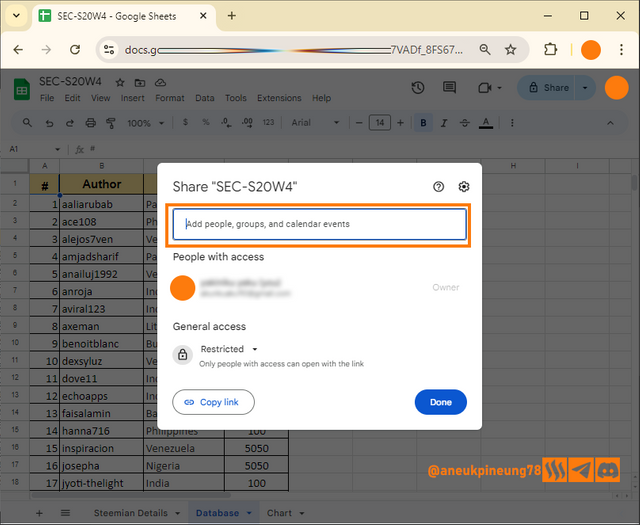
Image is clickable and might show larger resolution. - Like so, and hit [Send] button.
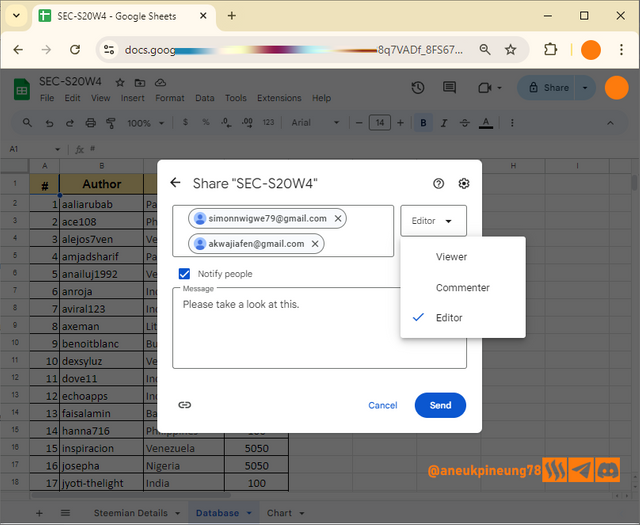
Image is clickable and might show larger resolution.
- Click the [Share] button.
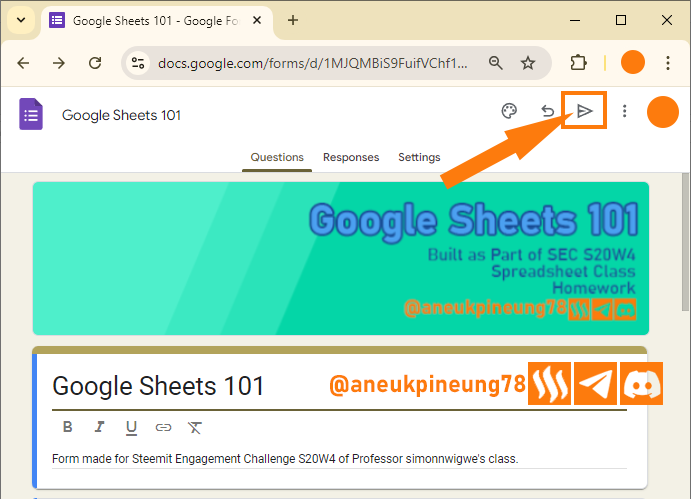
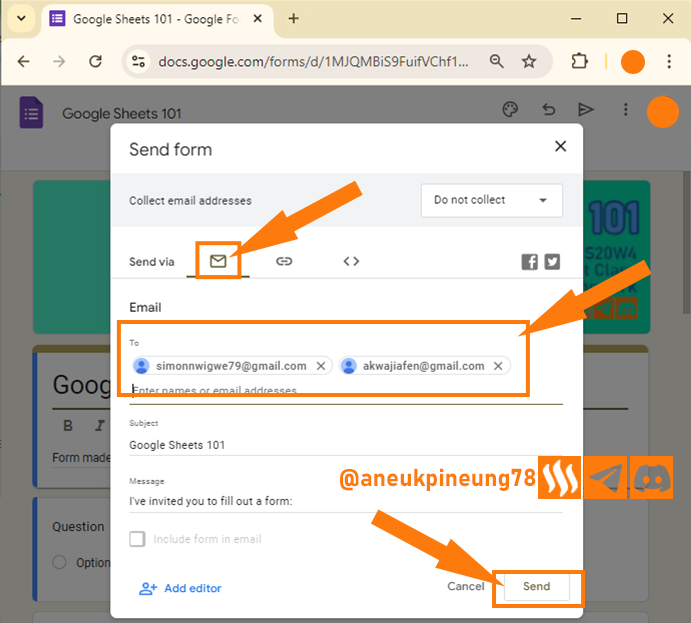
- Adding Collaborators to Google Form
- Hit the [Send] button.
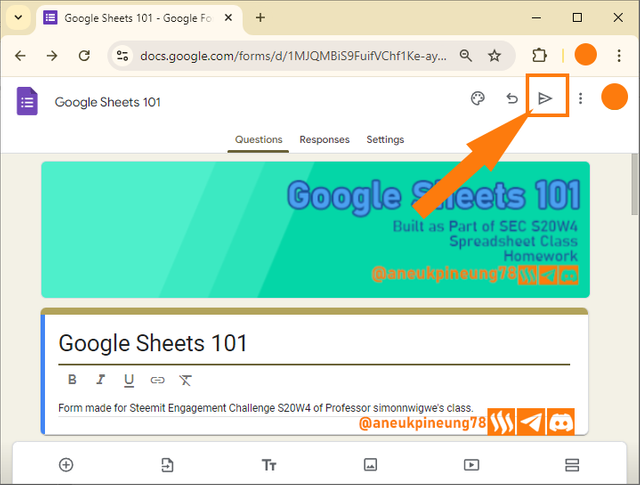
Image is clickable and might show larger resolution. - Look for [Add editor] button and press it.
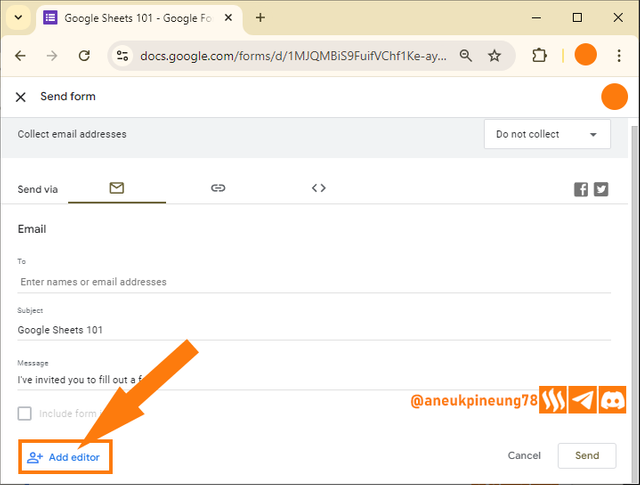
Image is clickable and might show larger resolution. - Fill in that box and hit the [Send] button.
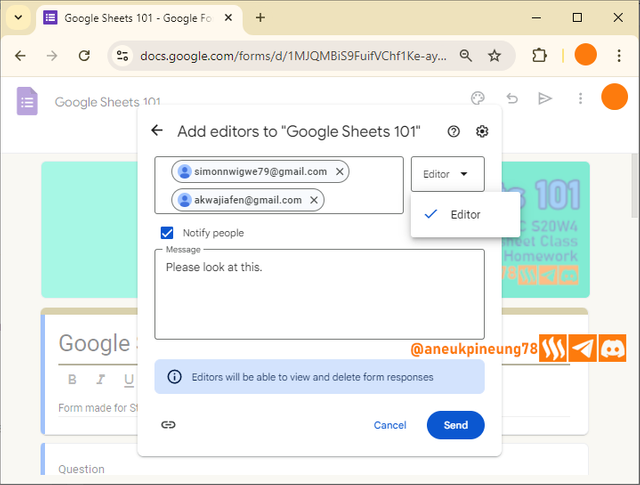
Image is clickable and might show larger resolution.
- Hit the [Send] button.


Thanks
Thanks Professor @simonnwigwe for the lesson. I invite @rayfa, @dhisky, and @bahrol.
Pictures Sources
- The editorial picture was created by me.
- Unless otherwise stated, all another pictures were screenshoots and were edited with Adobe Photoshop 2021.


https://x.com/aneukpineung78/status/1841337805332795736

Wow you have done a great job while participating in this contest. It is interesting that you have shared a step by step guide for each task. Best wishes for the contest.
Two days work and I really need my pillow ..
Hahaha same here but I did not give up and became able to complete mine as well.
I know that you are a fighter.
And hey, this week's class on crypto academy is really killing me,,, it feels like it's getting harder and harder by the week on the academy,, or maybe it is me getting weaker and weaker ,, what you think? haha ...
Yes the tasks are getting harder and harder. Actually this week I haven't yet explored that course yet so I can't say anything right now.
But I think you will be great at it, since it is involving some programming to execute the automatic trading (buy or sell).
Okay. Good day then.
Oooh let's see when I get time for it.
I also think that you could come out with a code for an automated trading.
Congratulations, your post has been upvoted by @scilwa, which is a curating account for @R2cornell's Discord Community. We can also be found on our hive community & peakd as well as on my Discord Server
Felicitaciones, su publication ha sido votado por @scilwa. También puedo ser encontrado en nuestra comunidad de colmena y Peakd así como en mi servidor de discordia
thank you,,,
Congratulations on bringing a quality content. You have earned a positive vote from team 2, and it is delivered by @ashkhan.
Many Blessings...🙏🏻
Thanks, @ashkhan I do appreciate it, many blessings to you and the team as well,,
Your surname is so famous in Indonesia. We're aware of at least 2 Khans. And now there's 3 that I am aware of. Have a great day.
Wow I am grateful for this honor. Thank you for your kind words. Can I know the names of other 2 khans? I don't have much links with Indonesians.
Thanks for everything brother @aneukpineung, i'll learn it
You are welcome, please join if you find some times to. it is great.
You understand this topic well, I have seen the whole practice of the material that is being worked on. You are indeed an expert.
It seems that for the next season it is necessary to become a teaching team, I am waiting for important material from you so that I can learn and deepen other knowledge that is still shallow
I have been using MS Excel in my work for no less than 2 decades now. And the internet boom has changed the way we work to some extent, and with it I also got to know Google Sheets, getting more or less the same benefits that I got from MS Excel, plus web-based collaboration capabilities, is a pleasant experience, and certainly helps when we need to work with friends from far away, or when we are in a mobile position where we can access Sheets from anywhere as long as there is an internet connection.
Spreadsheet apps (including LibreCalc and WPS Sheet) basically work the same way, although I have found some differences between Google Sheets and MS Excel in some formulas, especially in the process of analyzing complex data. I never used LibreCalc on a practical level, just looking, so I don't have anything to say about it.
However, even though Spreadsheet has long been an application that I use in my work and personal needs, still, the more I learn, the more new things I can get.
I still don't have enough confidence to join the teaching team or anything else. I respect those who come forward and do good things for Steem, not limited to the teaching team but also in other initiatives such as Community Curators and so on. Anyway, thanks for your appreciation. And may you have a great life.