Post Payout Report 22nd Aug - 28th Aug
This report provides a snapshot of posting activity on the Steem Blockchain over a 7 day period.
- How much is paid out on posts?
- What groups are getting the payouts?
It has been a few weeks since I ran this report (Post Payout Report 8th Aug - 14th Aug), observations since the last report are:
- Fewer Large Individual Posts (e.g. Fig 3) which likely just indicates people less willing to spend money on bid bots.
- The aggregate payouts in the week are down slightly but stable. This is driven by the Steem Price. A fixed amount of Steem is produced each week but the value (in dollars) varies as the price fluctuates.

Without a doubt money talks. Many are attracted to Steemit for the rewards. A rise in price correlates to increased user activity and increased funds for distribution via the reward pool. Focusing on the payouts of posts we can get a feel for a key driver of activity on Steem/it
This report is divided into 3 sections. In the first section we analyse individual post payouts in detail. In the second section we take a weekly view focusing on the relationship between different types of authors. The final section looks at the top 50 payouts by individual account.
We separately analyse the Payouts by:
- Reputation of Author
- Steem Power
- Date of Joining / Duration
- Automated vs Manual Posts
This Automated/Manual categorisation is based on frequency of posting activity over the 7 days
The data for this report is sourced from https://steemsql.com/ by @arcange
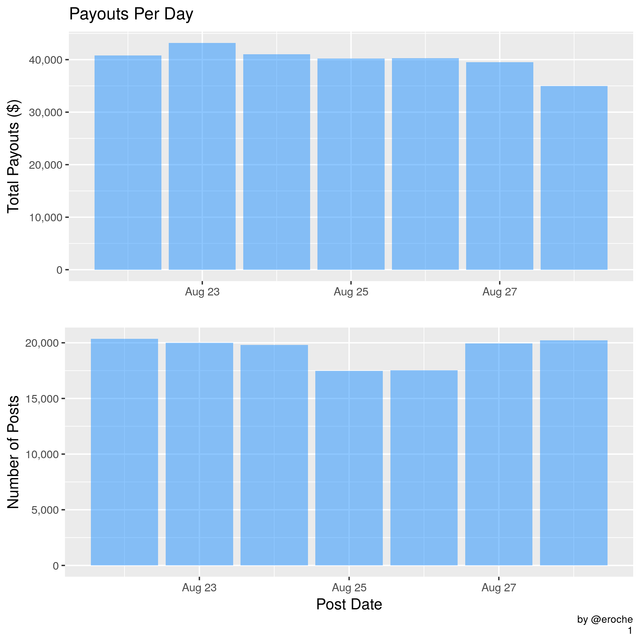
Payouts per Day (ex comments)
Over this 7 day period there was a total pending payout of 280k $ (as of yesterday).
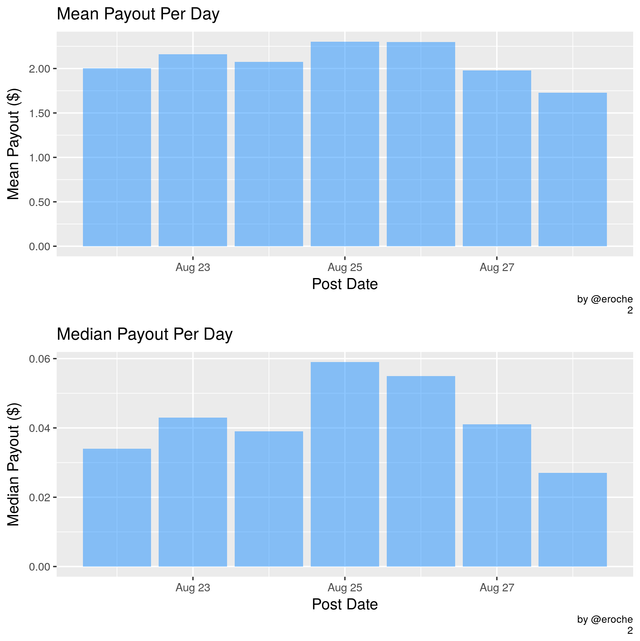
- The mean payout per post is 2.07 $
- The median payout per post is 0.04 $.
The next graphs shows the breakdown of these figures on a daily basis.
Individual Posts
As can be seen from the difference between the median and the mean post payout there are some large outliers. This next graph shows the payout on individual posts for each of the last 7 days.
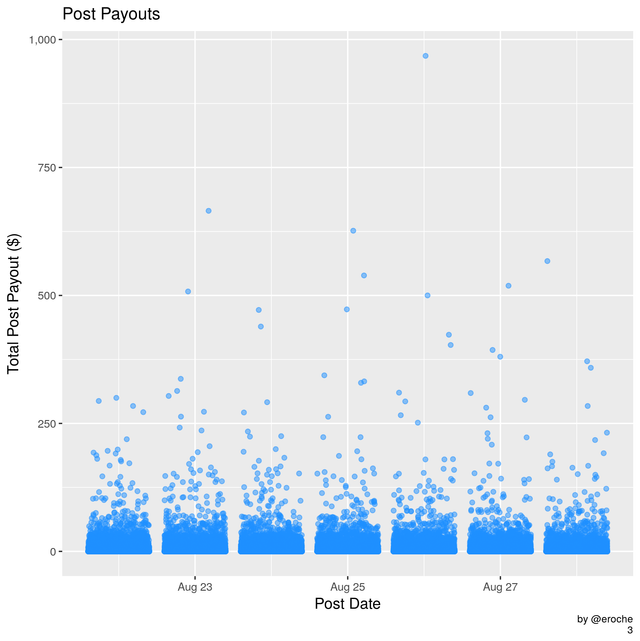
Each dot represents a single post
Daily totals give a high level overview but we can examine subdivisions or groups of authors to get further insights into who getting the posting rewards, and who is posting.
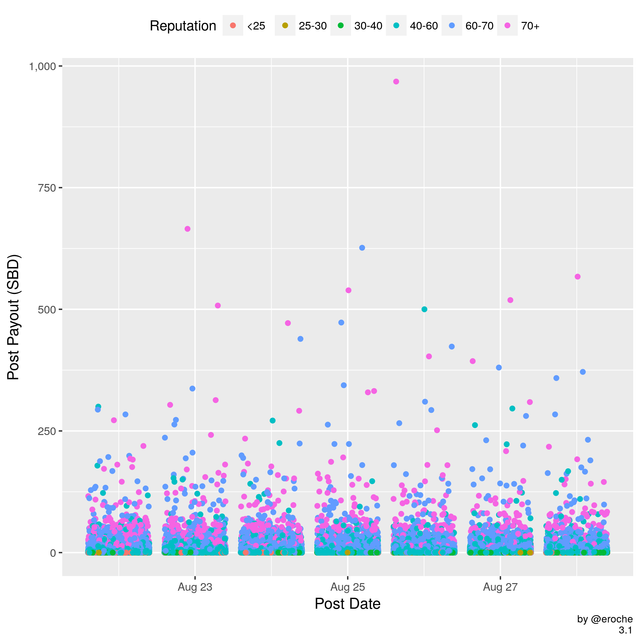
The colour in the following graphs represent different cohorts of Steemit Accounts. This highlights activity on these different groups of accounts.
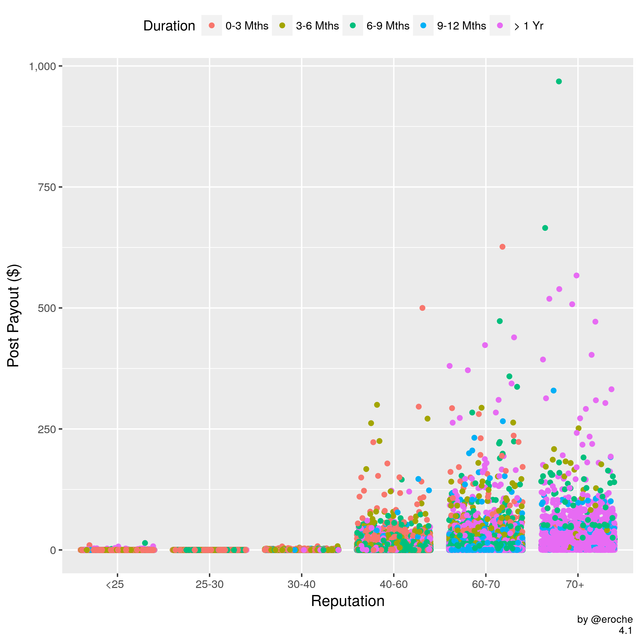
Reputation
It can take a while to build your reputation and the system is designed so that it is easy to lose it. You don't want to get downvotes from people with higher Rep!
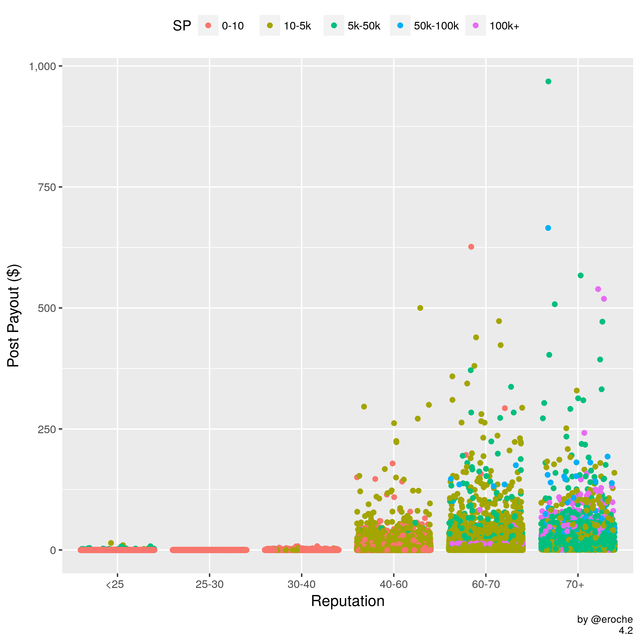
How much are posts making each day for people of different Reputations?
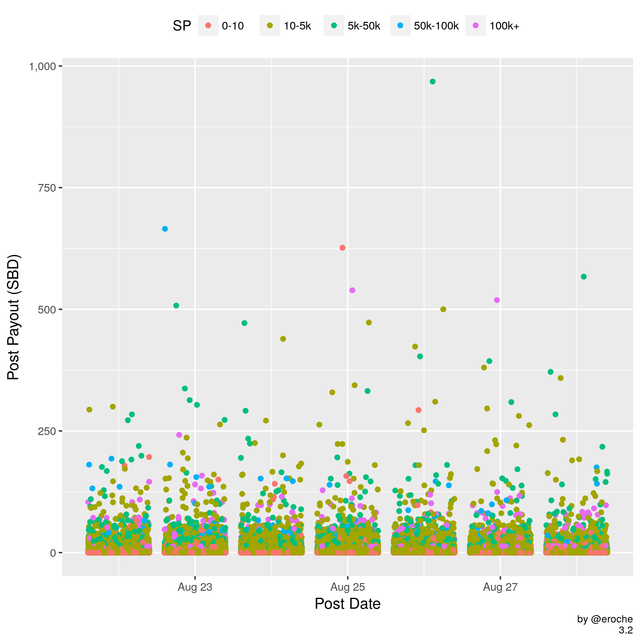
Steem Power
Steem is a stake weighted platform. If you have more stake your vote is worth more.
How much are posts making each day for people with different levels of Steem Power?
Account Duration
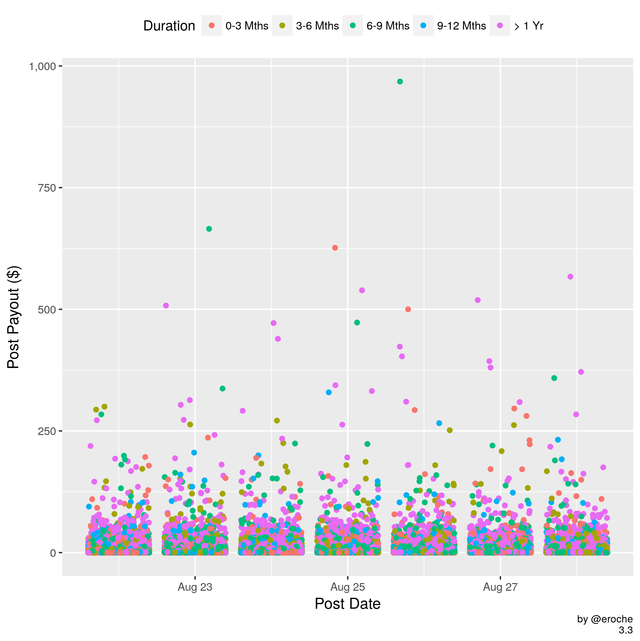
The first accounts were created in April 2016. We are now past the 1m account mark. Absolute number is important but retention is also important. * How many people who joined over the course of the last year are still posting? * Who is creating the bulk of the daily content?
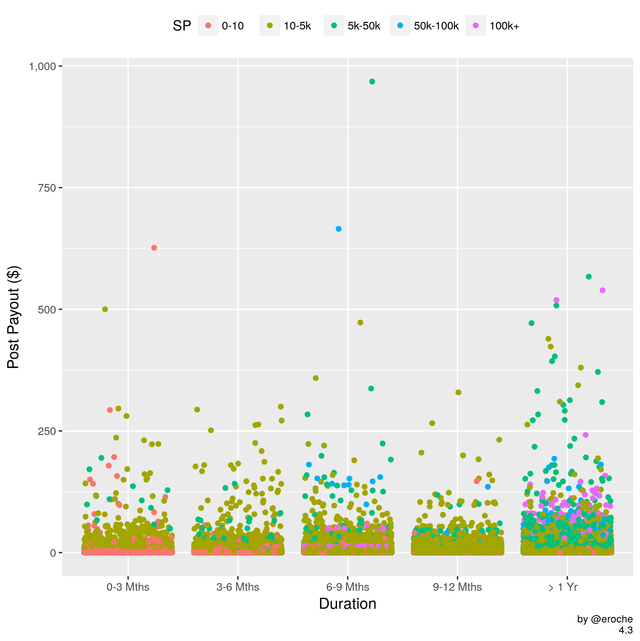
How much are posts making each day for people that have been on Steem/it for different lengths of time?
Automated Accounts
If there is one, what is the number of comments a day that we could use to identify automated accounts?
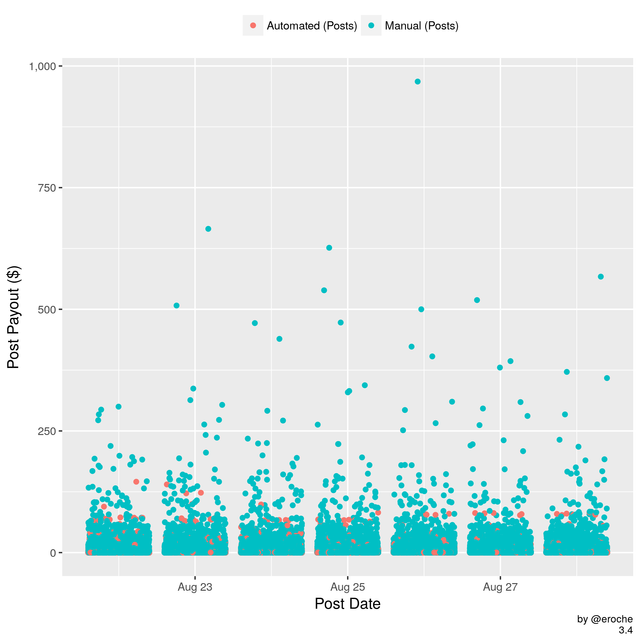
- I would propose anything higher than 4 posts per day (on average) uses some sort of automation. This number may not be correct but it's a starting point for our analysis.
- Automated accounts may post daily reports or in some cases may just be people spamming the system with low quality content or content copied from other sources. Not all automated posts are bad and some provide a useful function such as daily statistics, market analysis etc. Splitting out these automated accounts will be more relevant for comment activity however it's also worth tracking for posts.
How much are automated posts making each day?
It is useful to look at numbers of posts on a daily basis but aggregating over a longer period gives us additional insights.
Posts per Week
In the second section we take a weekly view of post payouts with the aim of identifying different cohorts of posters over the week.
Let's examine the breakdown of the weekly post payouts by the categories we have looked at before.
Reputation and Duration Since Account Creation
Reputation and Steem Power
Duration Since Account Creation and Steem Power
We can also split the data slightly differently to look at these features. The remaining graphs in this section look at Posting Activity with account Creation Date Plotted on the x axis.
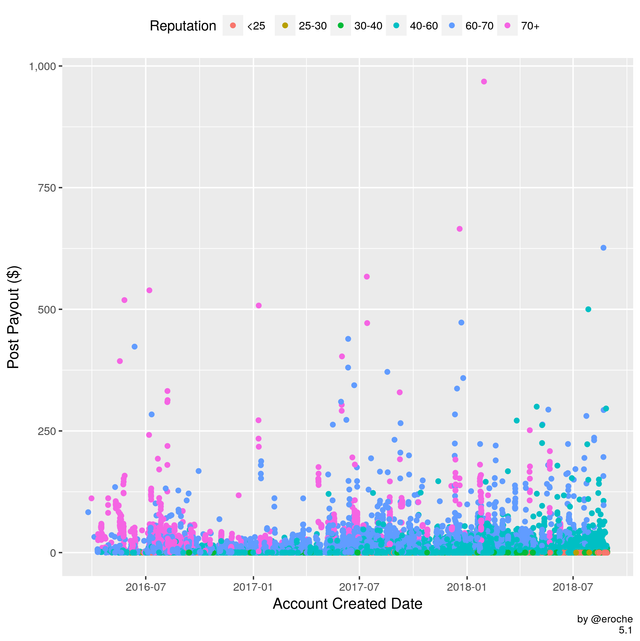
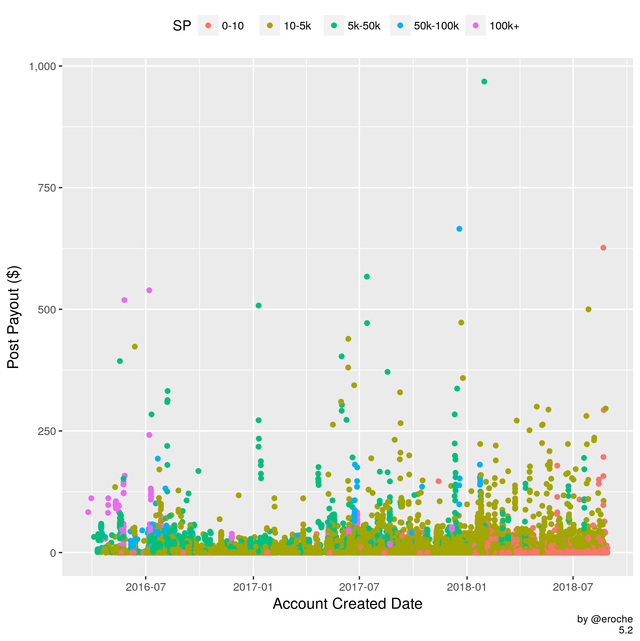

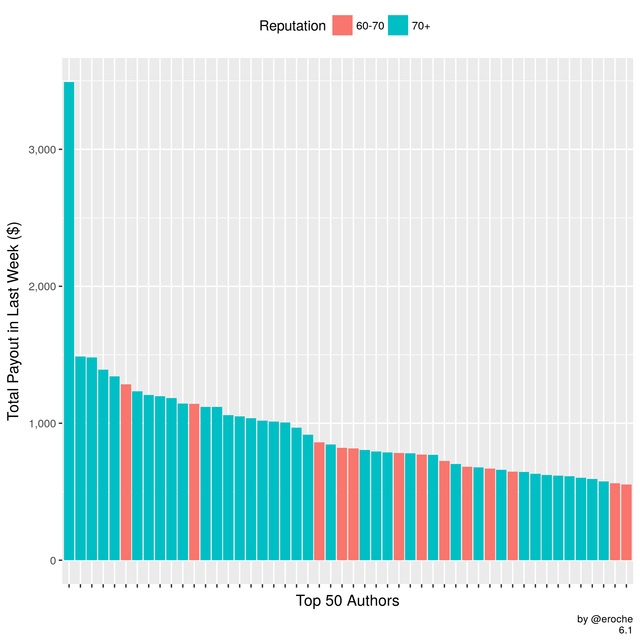
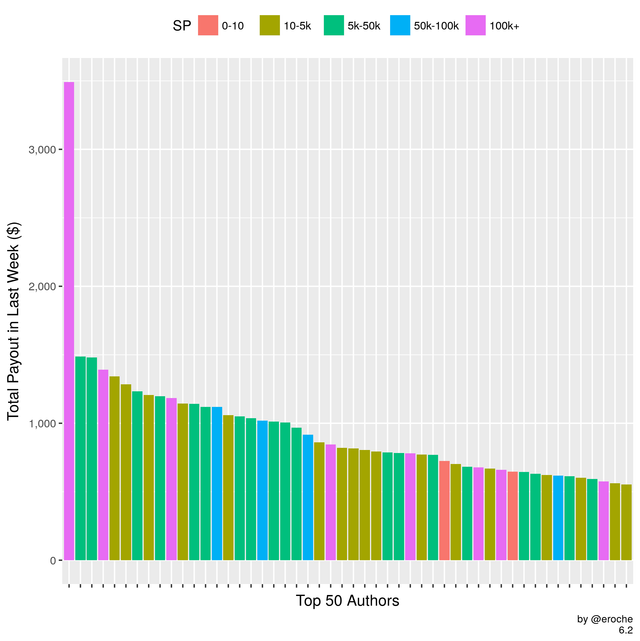
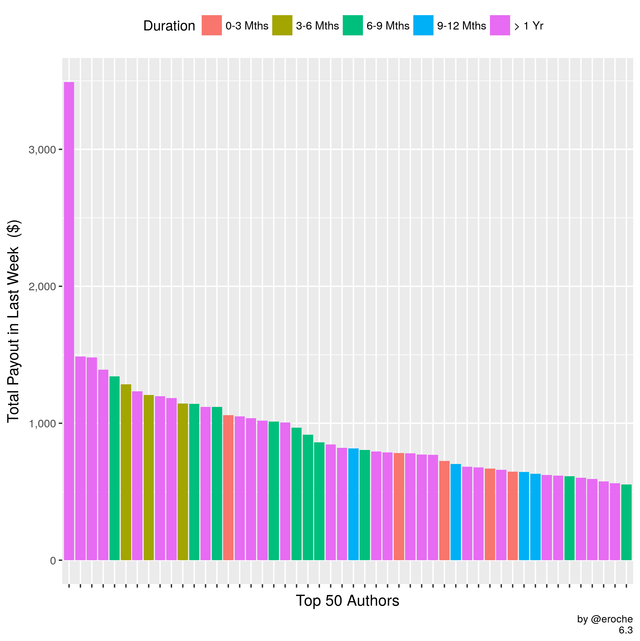
In this third and final section we look at aggregate payouts over the week on individual accounts.
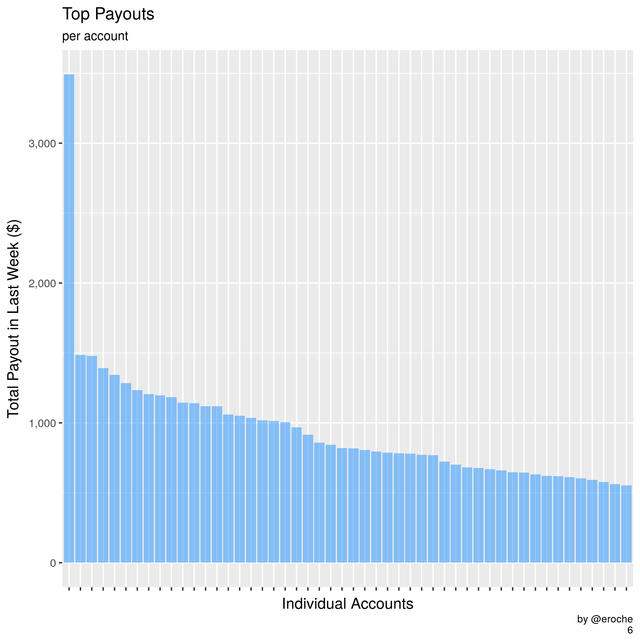
- The top few posters really skew this image. Lets look in more detail by highlighting the authors of the different categories we have looked at before.
If your looking for more daily statistics:
- @arcange produces daily reports with really useful data.
Interactive tools
- https://steemworld.org/ by @steemchiller
- https://helloacm.com/tools/steemit/ by @justyy
- https://tool.steem.world/ by @segypark
- https://steemdb.com/ by @jesta
- http://steemreports.com/ by @steemreports
- https://eroche.shinyapps.io/SteemAnalytics/ by @eroche
You may also wish to check out the following tag
- #blockchainbi and the members of the @Steemitbc community, spearheaded by @paulag, produce detailed analysis on all things related to Steemit.
What area of this report did you find most useful?
I would love any feedback to improve or clarify any of this analysis.
Will that trend higher when the price of Steem rises?
The relative scales will rise, but just comparing week on week there seemed to be less outliers this week than the last week (i.e. individual posts > $500), which is what my comment was referring to.
I love this analysis - it'd be good to get some cumulative percentages on post payouts - eg what % of paid posts earn...
< 0.05
<0.10
<1.00
For example.
Actually I'd be most interested in simply knowing what % of posts earn over $1.00! Nice simple number...
Posted using Partiko Android
The exact same thought occurred to me this morning. Here is a quick breakdown of the posts in the last week. Its staggering how many posts get less than 1 dollar. Nearly 80% of posts.
Wow thanks - I'll have to check that out when I get home. I think Partiko's unable to handle the tables!
Posted using Partiko Android
I saw $280k. That coukd change my life for good 😆
I think that would change a lot of lives. The great news is we can all take a crack at getting our share each week 😀
I was just playing with Steem Analytics. It is cool to get a graph of your posts, but is it possible to get a link to go to a post you selected? I'm interested to see who the votes came from.
At the moment if you go to the voting tab and scroll down you can get lots of detail on the voters once you select a post.
Cool. I love all the data we can pull out of this system and it's more open than other platforms