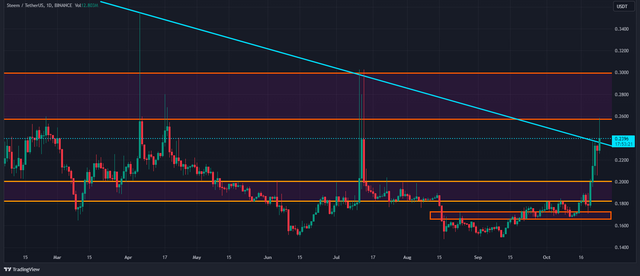
Steem Chart Analysis
Hello everyone. It's been about two years since I've produced content on Steemit. Actually, I've always been around. I'm still trading Steem. However, producing content regularly is really troublesome. From now on, I will try to share short posts without taking a break. Let me tell you about the Steem chart that I follow currently.

Steem price has been in a downtrend since April 2023. Below there is a supply-demand zone in the price range of $0.18-0.2. Above, there is a mature supply-demand zone between $0.26-0.30. We can wait for the $0.2 price level to become resistance for the start of a possible uptrend.
This is not a bullish or bearish signal. And this article is not investment advice. You should evaluate your investment decisions based on psychological and financial opportunities. It would be more useful to examine this publication as an educational study. See you in new posts, stay tuned.
Congratulations, your post is upvoted by CCS curation trail from CCS - A community by witness @visionaer3003.
Vote for @visionaer3003 as witness.
"Steem Chart Analysis" CCS le alakasi olmasada, CCS te postalarsan sevinirim 🙋
Merhaba. Tekrar içerik paylaşmaya, küratörlük yapmaya başlamayı düşünüyorum. Tabi ki, benim için daha iyi olur. Teşekkürler.