Forecasting STEEM prices: an econometrics tutorial for anyone!
Alright, this will be a quick tutorial. I will assume you have no knowledge of programming, no knowledge of timeseries econometrics, but I will assume you have some brains and a "let's do this" attitude. Having some basic knowledge of statistics is a plus. Don't be afraid to run into problems, solving is learning!
The code that we will develop will work, but don't expect to have a brilliant forecasting tool. However, it may open the doors for you to actually develop one! Many will argue that it is impossible to predict the market (there is math behind that statement), others refer to stories about "experts" that have been beaten by monkeys or blindfolded people throwing darts at random stocks. I have made many forecasts, and can tell you that it is very hard to make a good prediction, but I have coded a lot of tools that consistently beaten a random guess. This is your first step to become a data analyst and, if you manage to get through this post, you will generate your own empirical evidence about the efficiency of the STEEM market!

After this tutorial I hope to have opened a door for you. You have written your first simple forecasting script that imports STEEM prices data and predicts the future. We will use R, a matrix programming language similar to matlab. Don't be afraid, we will keep things simple and I will provide all the code!
Let's just do it!
Ok, you will need to download and install R (this is the windows install, R is available for mac and linux too).
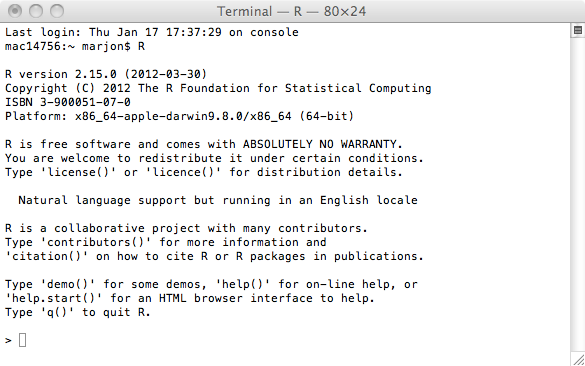
Installation may take some time, if you're stuck just comment. I'm sure a lot of users here are familiar with R, so we can help each other out! When you are finished, start R, the terminal will look something like this.

The text will be slightly different, as this is from an older version!
In this environment we can execute code. Try it for yourself by typing this into the console:
x = 3 + 3
print(x)
That wasn't to bad right? The console environment is not suitable for developing code. For now we can use something like notepad, but if you're a more serious type of person I recommend installing a proper text editor. Pesonally, I use sublime text for a lot of things. You can even integrate the R console (and many other programming environments) into sublime text. If you like to know how, let me know in the comments and I might make a tutorial some other time!
Let's get serious
Ok enough chitchat, we will need to install a couple of packages. These are pre-made collections of functions made by other users. This will help us a lot! Go ahead and install forecast:
install.packages("forecast", dependencies=TRUE)
We will use this package to fit an autoregressive integrated moving average model. I will not explain how this works as that would require a very big post, but all you need to know is that this is an econometric model that tries to fit the data by using historic values and moving average components. The code is very smart and searches for the best model automatically, so therefore it is great for this tutorial!
Now we need a data feed!
We will need to import steem prices into the R environment somehow before we can fit econometric models. I assume you didn't keep track of all the historic prices yourself, so I made a function that imports the data for you from [Poloniex](https://poloniex.com/support/api/} using their api.
Install these packages:
install.packages("RCurl", dependencies = TRUE)
install.packages("jsonlite", dependencies = TRUE)
Enter the following in the terminal to create the new function:
req.poloniex <- function (days, period, currency) {
base1 <- "https://poloniex.com/public?command=returnChartData¤cyPair="
base2 <- "&start="
base3 <- "&end=9999999999&period="
start = as.character(round(as.numeric(Sys.time()) - days*86400))
call = paste(paste(paste(paste(paste(base1,currency, sep = ""),base2, sep = ""),start, sep = ""),base3,sep=""),period, sep="")
data = fromJSON(getURL(call, .opts = list(ssl.verifypeer = FALSE) ))
return(data)
}
Now R knows how to request data from Poloniex. So let's give it a try!
library(forecast) # this loads the forecast package which we will use in a short moment
library(RCurl)
library(jsonlite)

steemdata <- req.poloniex(days=2, period = "1800", currency = "BTC_STEEM")
This requests data from the last 2 days, with half hour (1800 seconds) intervals, for the BTC/STEEM pair.
Let's see what we got!
print(colnames(steemdata))
You can see that we have imported:
[1] "date" "high" "low" "open"
[5] "close" "volume" "quoteVolume" "weightedAverage"
Let's make a simple plot of the closing prices!
steemprices <- steemdata[,"close"]
plot(steemprices, type = "l")
It doesn't make sense for me to show how my graph looks, because by the time you will be plotting your data, you will have requested newer prices. Either case, it should look like the STEEM graph on Poloniex if you select 2 days left bottom and 30 minutes at the right.
Let's do magic!
We will fit the ARIMA model on the closing prices:
auto.arima(steemprices)
This command will fit various specifications of the ARIMA model, and it returns you the best model fit. With my dataset (yours will be different) I get:
Series: steemprices
ARIMA(0,1,2)
Coefficients:
ma1 ma2
-0.2089 -0.3560
s.e. 0.0992 0.0978
sigma^2 estimated as 5.343e-09: log likelihood=770.78
AIC=-1535.56 AICc=-1535.29 BIC=-1527.89
If you have had some statistics courses you might be able to interpret this a little bit, but in short is shows that we have fitted two moving average components and no autoregressive components. If you are familiar with econometrics, this by itself is useful information, but for most people this looks just like abra kadabra.

Luckily, we don't need to know everything to make things work. Store the model in an object:
arimafit <- auto.arima(steemprices)
the "ma" terms are in fact part of some equation that we can combine with the price data to predict the future price. So let's do that!
steemforecast<- forecast(arimafit)
print(steemforecast)
plot(steemforecast)
You can see that the price forecast converges very quickly to a straight line. That is our best guess for the coming hours.
So let's see if it actually works
Of course this is a very simple model, so we shouldn't expect too much from it. But Let's put it to the test anyway!
We're gonna do a little back test!
steemdata <- req.poloniex(days=4, period = "1800", currency = "BTC_STEEM")
steemprices <- steemdata[,"close"]


T = length(steemprices)-1
results = matrix(ncol=2)

for (t in 96:T){
    data = steemprices[(t-96):t]
    forecast = forecast(auto.arima(data))$mean[1]
    true = steemprices[t+1]
    results = rbind(results,(cbind(forecast, true)))
}

results = results[-1,]

plot(results[,1], type = "l", col = "blue")
lines(results[,2], type = "l", col = "black")
This block of code will request 4 days of data, and then uses 2 days of data to predict the next half hour price consecutively for 2 full days. The plot you will have in the end shows your forecasted line (blue) and the true data sequence (black).
So let's see if we can get some feeling of the predictive power. There are a lot of criteria, but now we will simply compute the percentage of correct predictions when it comes to up/downward movements.
dresults=(diff(results)) # this takes a first difference

dresults[dresults>0]<-1 # replace increases with a 1
dresults[dresults<0]<-0 # replace aprice decrease with a 0

accuracy = sum(abs(dresults[,2]-dresults[,1]))/length(dresults[,1])
print(accuracy)
If everything went correct, you should find an accuracy of around 50%, in line with the "Efficient market" hypothesis that I linked to in the introduction. I got very close to 50% (52% actually), this means that currently the steem market is operating efficiently! 52% might seem very low, but if you could consistently make 52% of your trades profitable, you shouldn't complain if you're actually making a trade every 30 minutes. Of course there are transaction costs, and maybe some movements (that are less profitable) are easier to predict than others.
We can do better models that look at seasonal components, transform the data, or model all kinds of dynamics and use data from different sources and currencies to get better forecasts, but for now we can be happy with our little tool. If you like, I can do some recommendations on where to study further!
What about STEEM dollars?
Steem dollars is a smaller market on poloniex, markets that have lower liquidity are easier to predict, but you will find that there is not enough liquidity to actually trade at a high frequency. Any case, you can try it out and change "BTC_STEEM" into "BTC_SBD" in the req.poloniex function. With the code above, I managed to predict around 65% correct with these simple lines of code. Not too shabby!
Happy analysis, and hope you've learned something new today!

I like your approach to giving people the truth.
:)
Thank you! That's what I like to do, if I was in for money I would not have stayed with university life :) my experience is that many people are not really interested in knowing things, but that one kid who has the drive to go for it deserves to have good access to knowledge!
most people just want to profit regardless what, knowledge, statistics.
I'll worship whoever can predict the top-5 explosive cryptos with whatever crystal ball
@chrishronic all that code made my head spin
Well if you want to try things out and have questions, let me know! I'll be here in the comment section to add details :-)
I'll definitely give a try. so rarely to find R-based quantitative codes in steemit