STEEM - new fail to break the resistance line at 0.31$
Hello all,
Here is the chart of yesterday :

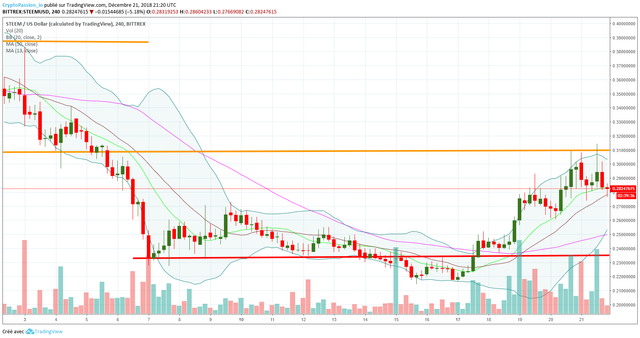
Here is the current chart :

We tested again the resistance line at 0.31$ but it is a new fail. It is very sad because the green candle was very nice and it could have created a nice break out. Let's hope that this new fail won't send us back to the support line in red because it is always the risk with this kind of pattern.
I wish you massive profits,
Cryptopassion.io

Legal Disclaimer : Never invest more than what you can afford to lose. I am not a financial advisor and the content in this article is not a financial advice. This post is for informational purposes only and provides only my personal opinion. It is important that you do your own research before making any investment decisions. If you make any trades after reading this post, it is completely in your responsibility. I am not responsible for any of your losses. By reading this post you acknowledge and accept that.


.gif)

.gif)
Would be nice to see STEEM back at even just a dollar!
This year has been quite painful :-/
I hope the price remain stable for a couple of weeks.
Posted using Partiko Android
I'm new to this, I've only populated with few tools, the main one, a simple trend line. I have applied one in the steemit graph of the last 2 years, I do not know if you noticed, that there is a clear trend line, from June of the year 2017 until now, totally a low trend, despite its increases, which They were good, but they were never able to go over that line. Coincidentally between today and 2 weeks if my calculations are not bad, we are touching that line again. Bearish trend line, which has dominated us for 1 year and 6 months.
To confirm this line, we go to the beginning of steemit, if they follow that trend line, and coincidentally we have only broken line once. And it was when steemit went up from 110K to 500k in satoshis. After falling back below the line in 2016, we never passed it again, only the maximum peaks grazed it, and then it fell.
And because the line decreases each time its value, to be penetrated, and coincidentally these days that line of years, is approaching the current price. This green candle of today, indicates something, maybe it is very good. I'm new to this, it's just my interpretation.
Good news @cryptopassion break the resistance line at $ .30 and we are consolidating above it ...
Soooooo close...