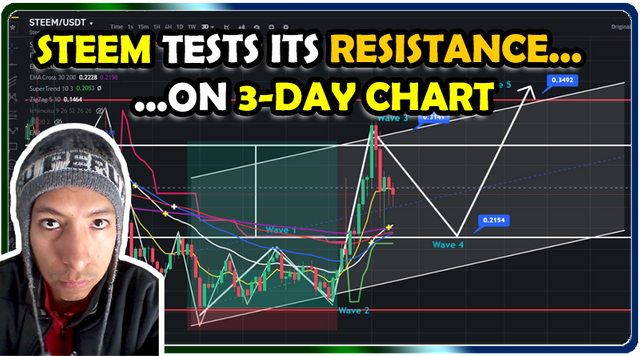
👊🏻Steem tests its 🔥resistance on 💥3-day chart

Hello, today I am analyzing "Steem" whose price on "binance" is at 0.2518 and on the 3-day chart
there has been an upward movement from 0.15 to 0.31
creating a wave 3 and now a wave 4... to end with a wave 5 at its resistance.

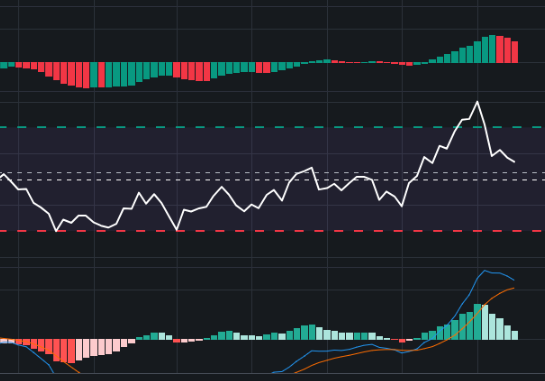
The "Awesome" indicator indicates that the price is expensive, the "RSI" indicates that the price is no longer overbought,
while the "MACD" has lost bullish strength and is in a retracement phase for the moment.

If the price is not able to break 0.35 it is possible that it will return to the low.
None of this is investment advice, draw your own conclusions.
Have a great day and see you in another technical analysis.
You've got a free upvote from witness fuli.
Peace & Love!