Scientific Analysis of Success on Steemit [1]

You must read this article, it is very important for your success on Steemit. I have scientifically analyzed the Profit/Article, Upvotes and Comments and their relation to eachother, the results were very interesting!
I am in the process of quantifying the parameters needed to succeed on Steemit, in this and future articles. In this article I will reveal the relationship between these 3 variables and how they relate to eachother. As a test dummy I have used my own data and progress on Steemit.
I have 82 posts so far (excluding this of course), and I have made Profits ranging from 0 to 74 SBD (more close to 0$ of unfortunately). In the research I will exclude the Re-Steem posts, and focus only on the data of my own. Let's start!
THE RESEARCH
1) My Theories/Expectations
Now first of all let's talk about my pre-expectations. Before doing this I had the following hypotheses:
- [1] The more I write the more profit I make / article on average (my profit increases overtime)
- [2] The number of Upvotes on the article determine how much profit my article will make
- [3] The number of Comments on the article will determine how much profit my article will make, although I expect a weaker relationship than Upvotes (since the number Upvotes determine the
hotandtrendingcategorizations) - [4] The more Upvotes an article has, the more Comments it will get
And I didn't just thought this of myself, but I expected this to be the general rule of thumb for all Steemit users. These hypotheses are all logical, who would doubt these theories on first sight no? Well, it turns out we can only trust evidence, and the results were shocking!
2) Forecasting
We have 3 Timeseries variables: Steemit_Comments , Steemit_Upvotes, Steemit_Profit, which represent the Comments, Upvotes on all my previous articles.
I had to manually copy-paste the data from the Steemit user page, and it looks messy so it needs some text formatting:
A Very Good Idea for Steemit Steemit is missing 1 critical feature that I think would add great value to it, help all authors, and would be fairly easy to implement. $0.11 2 days ago by profitgenerator55 in Steemit 39 11 Steemit Most Important for Free Speech! Many of you don't know this but yesterday October 1st 2016, a historical event has happened. $0.88 3 days ago by profitgenerator55 in Steemit 50 6
It can probably done with a python script automatically, but I had to do it manually. Then I had separated the 3 variables, the: Upvotes, Comments and profit, and started working with it.
I have found out that the time series has no constant, and the best model was ARIMA(4,2,2) for it (for your statistics it might be different). I had then used this model for all 3 variables to be consistent. The errors were the following:
| Variable | Mean Absolute Error |
|---|---|
| Steemit_Comments | 5.2178 |
| Steemit_Upvotes | 8.9393 |
| Steemit_Profit | 7.5602 |
Relatively low errors, given that there was some unexpected whales recently liking my posts causing some variance, other than that, it's pretty accurate and reliable model. Then I proceeded forecasting for the next 30 articles (till 112).
NOTE: It didn't took into consideration the time elapsed between articles, but I highly suspect it doesn't matter, unless I become inactive for 1 year or so, posting once a day or once a week hardly makes a difference in my opinion, so the x-axis is not the time itself but the number of articles, with whatever frequency I post them.
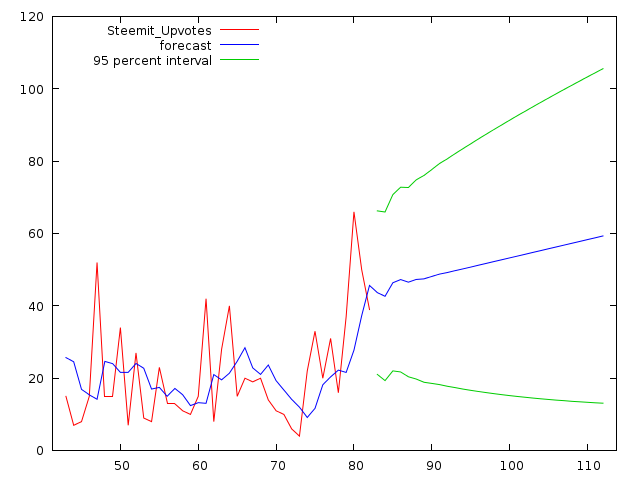
FORECASTED UPVOTES:
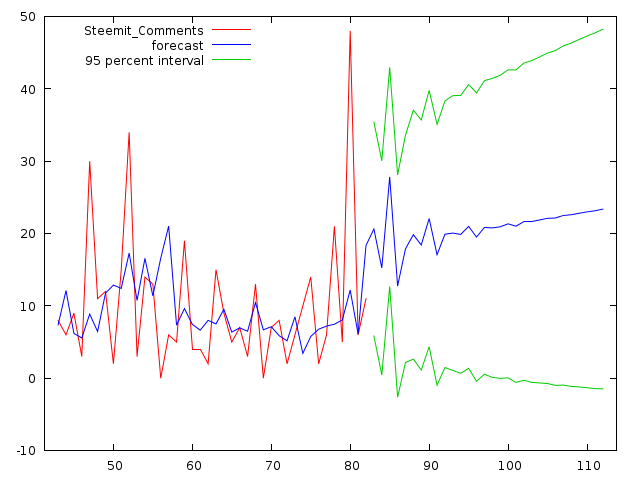
FORECASTED COMMENTS:
FORECASTED PROFITS:
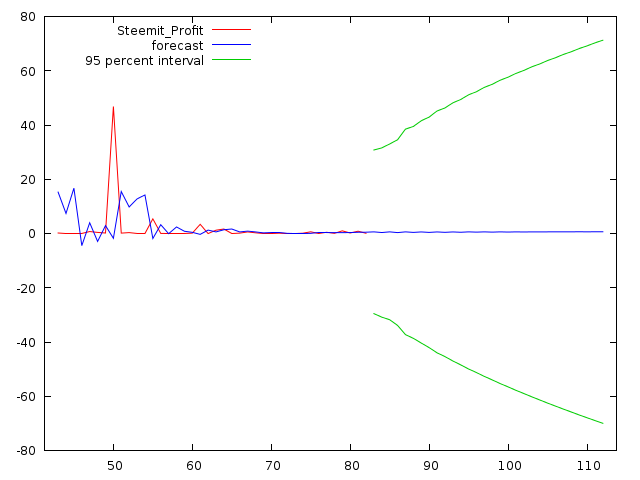
So yes this is how it looks like. It is going up, that is good news. Hypothesis [1] confirmed, it is true that the more I post the more money I make. The model also predicts a pretty sensible 95% confidence boundary, not that values under 0 are nonsense, so we are biased to increase from the start!
Now unfortunately my Profits are barely increasing, it forecasts under 70 cents for the next 30 article on average, which is pretty bad (I am being paid less than a sweatshop slave for quality articles like this).
The forecasts for this article are: 20.63 Comments, 43.68 Upvotes and 0.64 SBD Profit(with 95% confidence that profit < 30.80 SBD).
Now of course now that you know this, you might just post extra Comments just for the sake of it, to invalidate this forecast, however the Upvotes and Profit payout might be harder to manipulate.
3) Correlation
Now that I know how much should I expect from each of these variables in the future, let's explore what are the relationships between them.
My next hunch is looking at hypothesis [2], and by plotting them against one another, it seems like there is some faint correlation:
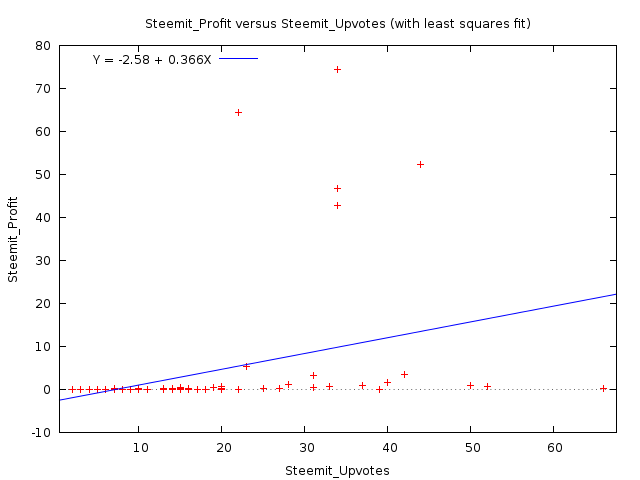
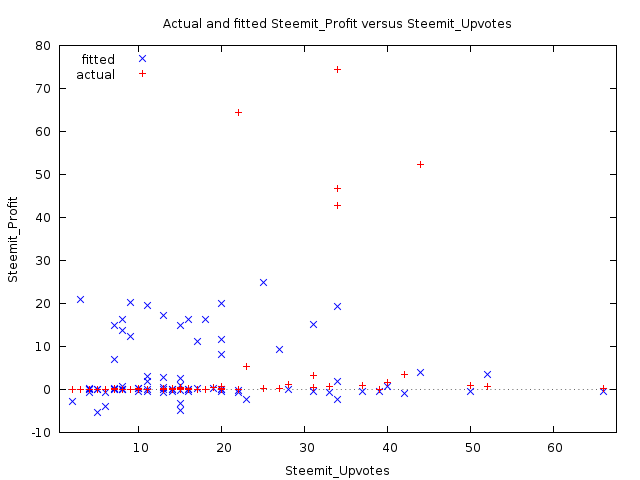
And we can see that there is some faint correlation with very volatile residuals, but we need to do a cross correlation test vs different lags of the variables to know exactly.
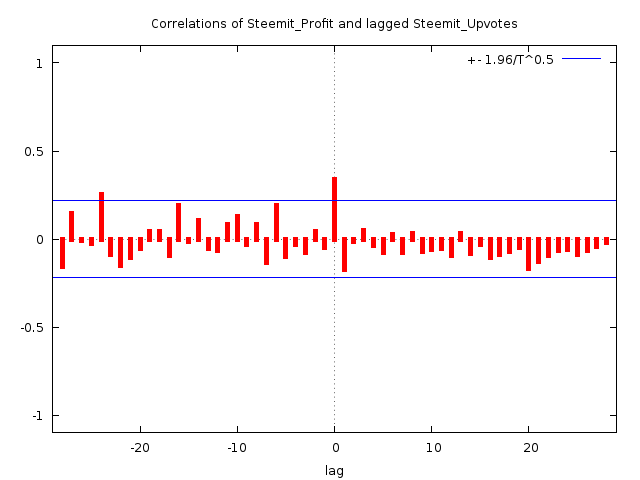
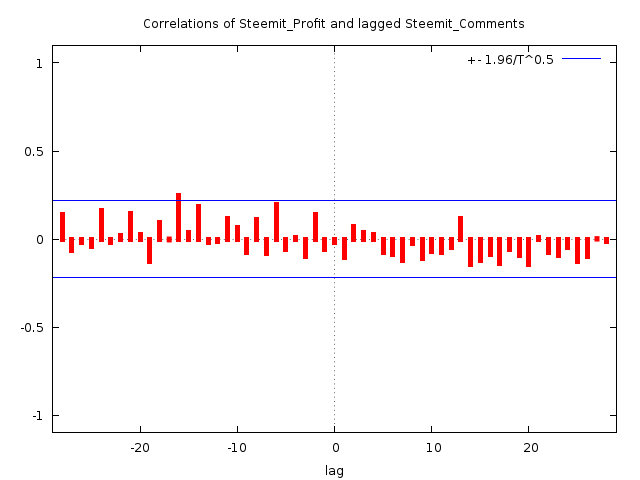
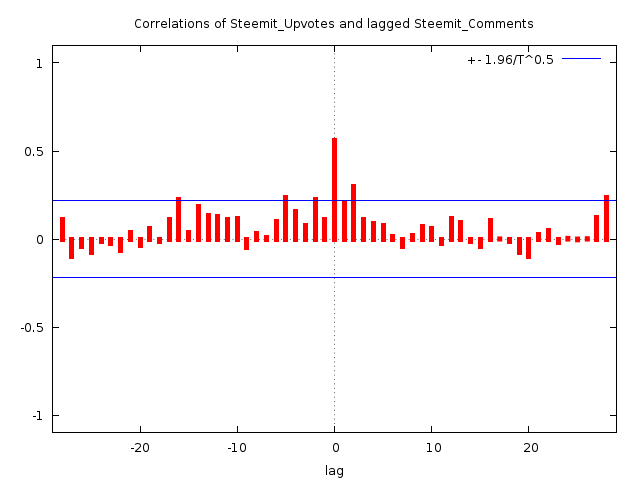
So I plotted a cross correlation chart against their own lagged variables to find a pattern:
| Variables | Correlation [0] |
|---|---|
| Steemit_Profit vs Steemit_Upvotes | 33.692086% |
| Steemit_Profit vs Steemit_Comments | −1.878444% |
| Steemit_Upvotes vs Steemit_Comments | 55.706716% |
Turns out there is absolutely no correlation between the Comments and the Profits, and there is little correlation between the Upvotes and the Profits, however there is significant correlation between the Upvotes and the Comments.
Therefore hypothesis [2] and [3] is very likely false, and [4] is likely to be true. This is pretty shocking, who could have guessed that this is the situation? And even though this was done on my performance, I highly suspect this can be applied to all Steemit users (but I will do more testing in the future).
4) Summary
- Looks like the more I post, the more engagement I get on the articles, more Comments, more Upvotes, more Profits
- Unfortunately the number of Comments doesn't
directlyinfluence how much profit my article will make (however it might influence itindirectly= good comment might get upvoted by whale, or commenting back might get more followers) - The number of Upvotes does have some correlation with the Profits, however a 33% is not significant enough, but I still think the more Upvotes, the better
- The more Upvotes you have does influence how much Comments I get, and vice-versa, but it hardly matters directly, since it still doesn't increase the direct Profits
- Remember Correlation =/= Causation, but it might hint to it
- The amount of Steem Power matters only, and 1 whale upvote might be worth more than 100 newbies upvotes. Steem Power is still the biggest factor for profit, and it's very unequally distributed
I have also did a side-experiment, by fitting & forecasting the Steemit_Profits using the Steemit_Upvotes or Steemit_Commentsas regressors, but it did give out a higher Mean Absolute Error, than if I had used them alone, therefore we can conclude that they don't really bear that much influence on the model, nor do they add any extra predictive powers to the model.
Also these correlations are not very strong, since only the LAG[0] is correlated, which hints to a weak correlation. Normally, if the correlation were real, you would have all lag orders correlated by eachother , and the effect would decrease linearly as the lag order increases. You only see some lag correlation at the Steemit_Upvotes vs Steemit_Comments chart, while the other 2 show practically none.
Therefore this research is pretty much conclusive for my own results. In my future articles I will check some other users too, and see if their data fits this theory, and it should.
Disclaimer: The information provided on this page might be incorrect. I am not responsible if you lose money using the information on this page! This is not an investment advice, just my opinion and analysis for educational purposes.
Credits: Original Steemit Logo by @d3m0t3x
i guess it depends on WHO the upvote comes from right? not just the amount of upvotes
interesting data!
Yes STEEM POWER is the ultimate factor, it doesnt matter if there are 1000 people voting on an article, 1 big whale with more cumulative SP can outpower them all, all by himself.
Yes in the future the SP disribution might become more equal, but currently, it all depends on the whales.
not only WHO @doitvoluntarily , but also how much they throttle down that up vote. I see it on my up votes all the time. Up voted by a whale, but get cents. Nonetheless, something is better than nothing. Spreading out the love is better than placing it in the hands of a few.
full $teem ahead!
@streetstyle
I'm upvoting this for effort and the approach, but I guess the conclusions could probably be reach empirically with less effort :-)
Yes, but it's always good to have evidence, otherwise it's just a hunch. The final conclusion is that only STEEM POWER matters, and how it is distributed.
But analyzing this can still be interesting.
well there goes your 95% confidence on a payout < $0.70! btw - I upvoted before blocktrades did :)

Haha, yes i guess I am lucky, i got in the 5% zone.
But you have to remember the accuracy/ datapoint is meaningless, what matters is the accuracy overtime. That it's why it's called a timeseries, many points were outside the confidence range, but on average they should be inside.
Besides looks like i get many upvotes lately, so the model might need re-tweeking soon if i am getting famous.
I will do a research soon on more established people with more posts like @kaylinart or @stellabelle, that will be more accurate.
Ah the beauty of science . . .
Yes it is beautiful, analyzing data is not at all boring when it comes to money.
Money is never boring.
For someone new to Steemit this is a little bit complicated, however, I will keep my eyes open for future posts
Thanks, it will become easy to understand later after you get used to steemit!
What basic coding and other skill sets does a new little engine need to know if we're gonna chug along on this thing without losing a caboose?
I am not sure if i understand what you are asking. If you are asking about what skills you need to do this then:
mathematical statisticsandquantitative analysis (time series analysis)is what i used in this article.https://en.wikipedia.org/wiki/Mathematical_statistics
https://en.wikipedia.org/wiki/Quantitative_analysis
https://en.wikipedia.org/wiki/Probability_theory
https://en.wikipedia.org/wiki/Time_series_analysis
Hmmm, so do I need to know all of that in order to use steemit?
No, i was just saying what science I use to do the research.
dito
Thanks for taking the time and apply some scientific methods to steemit posting rewards. What about the hypothesis [1] the more you post the more followers you get. And the more followers you have the more likely you receive upvotes. Or [2] the more you upvote yourself the more you are likely to receive an upvote. Or [3] the more comments you make on other posts the more followers you get.?
[1] yes I think that is true (but i will test this soon in a future article)
[2] you mean upvote others? probably true (i dont know if there is an API that gives you the data necessary, and compiling it manually would be horrible)
[3] i also think this is true, but it would be hard to compile the data, unless there is some API, let me know.
Yes I will do more tests in future articles, but especially working on the data of @kaylinart or @stellabelle with many posts.
How about: The number of posts on average a steemit user has to post before receiving a whale vote?
Upvoted. Very interstning work.
You make your graphs with kaleidagraph? Also I am a little bit confused by what the values on each axis means... maybe I am not thinking clearly right now. Would make more sense to me if they were labeled ( I'm lazy I think, and need to be spoon fed the information ).
No it's python & gnuplot.
Which chart you don't understand, write here and I will explain.
Interesting, I guess gnuplot generates very similar looking visualizations.
I think I got it after reading and looking more. I was confused with your forecasting plots, so the X axis is number of posts made while the y axis is the result in question be it votes, SBD or comments. Yes?
You also call some correlation, but the confidence in those calls must be very low. You should look at article profit versus total followers at time of publishing. I would suspect that more followers would lead to more SBD over time, however that too may not be the case.
I guess, and Gnuplot is free and pretty easy to use for these calculations.
Yes the X-axis is the number of articles and the Y-axis is the value, the amount of SBD, votes or comments made at that point (or forecasted).
This is heartbreaking...that it all depends on Steem Power and not the number of people who voted for you.
Indeed, until SP is distributed unequally between the top 100-200 people, this will hold true.
I am sure in the future as more people will invest in SP this will be less true, but you will always have whales.
Extremely interesting, thanks for sharing this
Let's look to the accuracy of your forecast ;-)
Yes, random surprizes like this do happen, but the forecast accuracy should not be measured for only 1 point, but overall. Besides i think i am getting famous now, so this is a turning point in the model. The model cannot predict changes like this, but it can adapt to it, once we have more data, that is why i will do another research on people with more posts.