A Comprehensive Cryptocurrency Trading Strategy
Learn Methods/Strategies
I want to preface this post with a brief talk about how to learn technical analysis. A lot of people focus on learning indicators. Few focus on applying the indicators. I personally use very little indicators. I am a price action trader, though some indicators have some value. I focus on the few indicators that have some value and have backtested data showing they have a statistical edge. If you are interested in learning how I settled on the few indicators I use, I recommend going through the Adam Grimes’ free trading course. If you want to learn TA, and the reasoning for why I use certain indicators, that is the place to go. That is a great place to learn the basics.
There are many other good resources for learning the basics. Investopedia has a very simple course, Stockcharts.com has some good lessons. There are a multitude of great books out there for learning the basics, or learning methods. Technical Analysis of the Financial Markets
A lot of readers of my blog are at the ground level, so I recommend starting there and then come back here to learn my method. Or find another method that more suits your personality. QuickFingersLuc or Brian Beamish are two that I really like. Brian Beamish’s method is similar to mine. I trade QFLs method in addition to mine, with some slight alterations. That will require a separate blog post, however. This post is for my bread and butter method.
Why Crypto?
I recommend newer traders, or traders with a smaller account balance to strongly consider trading Cryptocurrencies. The volatility is off the charts. Volatility equals potential. If you can be a winning trader here, you can do much better here than in equities. You can much more quickly grow your account in Crypto.
These markets have a lot of amateurs and not a lot of professionals. This equals opportunity if you are serious.
There are risks. High volatility does equal high risk. The exchanges have had many issues in the past with hacking, downtime, etc. I find these markets to be somewhat like a high tech version of Jesse Livermore’s bucket shops, if you have ever read Reminiscences of a Stock Operator.
Please do your research before jumping into this.
Prerequisites
I used to recommend going through my stock trading method series before reading this post, but it is no longer required. I do recommend learning the basics of TA first. See the resources I linked at the top. There are many parallels between my equities method and my crypto method. I have added in elements of the Brian Beamish “Little Old Lady” Method and Lucky36Luc’s method.
 Tools
Tools
For charting and alerts I use Coinigy. Coinigy has server side alerts. This feature by itself makes it worth the cost. I never miss an alert this way. I can set up SMS and/or email alerts. It is powerful and useful. Coinigy is currently working on scanning features which would be a huge deal for me and many other crypto traders.
Recently, I have begun to use a few other screening tools. These can help sift through the massive and growing amount of coins to try to find setups. I use both Strymex and Tradingview to search for “Episodic Pivots”. EPs are a setup I have traded in stocks for many years. Similar to the Jesse Stine SuperStocks. I look for flat dead bases that are breaking out of what I call the “Low Level Base”, and into the Stage 1 basing area. I will get into detail later on that. Below are my settings for the tradingview screener(% change >= 5 / Market Cap 10K to 5B / Relative Volume >=2):

Strymex settings are similar.
There a number of screeners for the QFL mean reversion method. Here are some of the ones, there are more popping up every day.
QFLs Slack and Discord also have people posting setups.
Exchanges I Use
I use GDAX to buy Bitcoin, Ethereum, and Litecoin. If you use Post Only, limit orders, there are no fees. Once in BTC/ETH I move some over to Binance, Bittrex, or Kucoin for alt trades. Binance is my primary alt coin exchange. Any popular alts that I cannot trade at Binance I trade at Bittrex, or Kucoin.
Trading the Large Caps
I primarily trade the Large Caps as a trend follower. I try to ride the bulk of the major trends. When in a long term BTC bull market I will be 100% in BTC and/or ETH. A lot of the alts still only trade versus BTC, so an increasing number also trade versus ETH. ETH is a nice one to be in for the lower transaction costs and faster transaction times when sending between exchanges. During long term BTC bear markets, I focus on shorter term trades of BTC, ETH, LTC, BCH versus USD on GDAX.
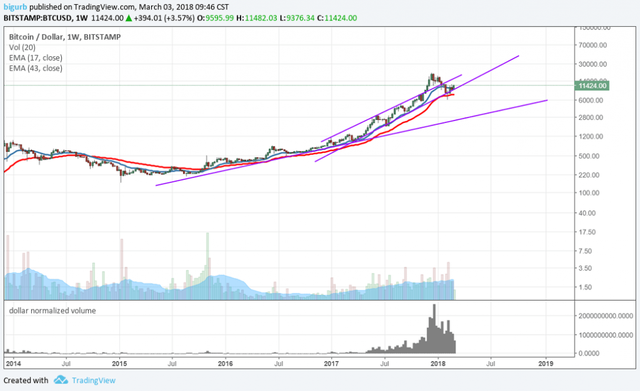
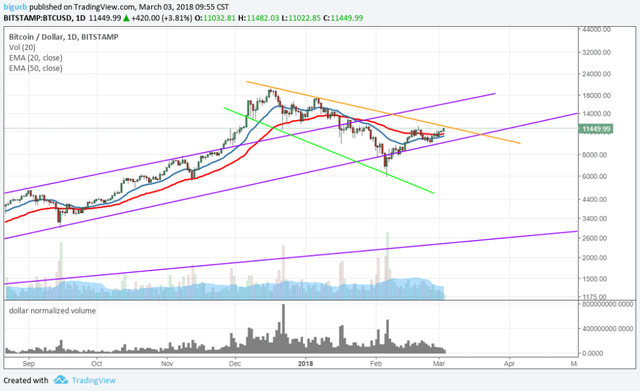
How does one determine whether we are in a Bear or Bull Market? Well, that is a challenge. The method I use is primarily long term trend lines. Long term moving averages can work, to an extent, but moving averages lag the market so much that the signals are slow. Here is a good system for utilizing moving averages to determine the trend. Basically apply 17 EMA and 43 EMA on the weekly for the long term trend, 20 and 50 on the daily for the medium term term trend, 20 EMA on daily for short term trend. The long term trend is one we are most interested in. Let’s look at a few charts.
 )
)
Here can see trend lines and EMAS both confirming the Long Term Trend.
 )
)
Bearish medium term trend signals..
The daily recently went bearish. I entered capital preservation mode before this. There are a lot of reasons for this, and that is why I do not rely solely on the moving averages and trend lines. Once the market broke above the 2017 upper channel trend line and went parabolic, I started to get very cautious. Parabolic blowoff tops always end in dramatic fashion. When exactly they end is hard to time, but they always end badly. There are a lot of other things one can employ to try to stay on the right side of the trend. It would take me a while to get through all of them so I will not get into that here. I make occasional posts on my feeling of the current market in my blog and Discord. It is difficult, but it is possible to get in sync with market.
Capital preservation is an important part of being a successful trader, in fact I view it as number 2, right behind the method. The method you use to trade is number one and your focus should be to constantly improve that method. Trade it for a while, make small incremental changes during slow market periods. Constantly re-evaluate and improve your method. Don’t get so caught up in things like trader psychology. If you a have solid method, trader psychology is not nearly as relevant.
Once determining the trend, I then look to enter BTC/ETH for position trades or swing trades depending on market conditions. In a long term Bull, I will stay in the large caps for very long periods of time. I then focus on alt coin hunting, which is where the real money can be made. I will lock in some USD profits on extreme moves, especially parabolic moves. I like to analyze the bases(pullbacks) as they tend to have many similar characteristics, such as depth and length of pullback. BTC in 2017 had many pullbacks that all looked extremely similar. I was able to enter new money in every one of the bases. It is hard to catch the exact bottom, but if the bull is in tact we can use a fairly large stop and still come out looking solid at the end.

Trade Examples
BTC
BTC I trade basically as a trend follower. It has strongly trended for all of 2017. Late in 2017 and early 2018 the trend changed. Every few days I adjusted my buy levels for attempting to catch the next 30-40%-50% retracement. BTC gave those pullbacks multiple times in 2017. Pull up a BTC/USD chart and look at these pullbacks. They exhibit extremely similar characteristics. A sharp initial sell off of the break of the uptrend line, followed by a swift rally that makes many traders think the danger is over(bull trap), followed by a slow, steady pullback. At the end, capitulation occurs, wherein there is a sharp drop followed by a quick reversal with huge volume. This creates a V-shaped bottom. Finally the right side of the base is filled out quickly and soon new all time highs are reached. The average length of these pullbacks is about 52 days(that came from Brian Beamish, but you can easily figure this out yourself).
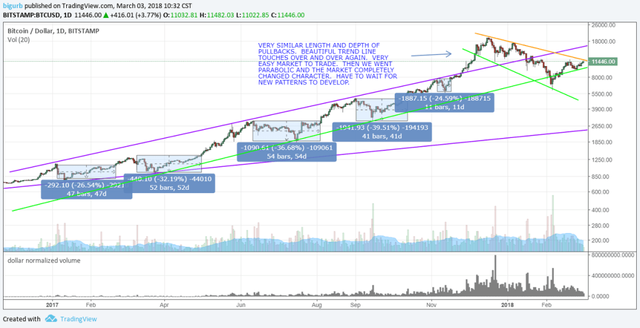
I entered into most every pullback in BTC in 2017. New money I had on the sideline would enter there. There were no sells until we had the blowoff top. Then I began to unload. If we had broken the bottom trend line, I would have likewise exited into cash at some point. Until the bottom trend breaks there is little reason to exit.
A lot of technical analysis is analyzing what has happened in the past in a particular market and trade based on the idea that history will likely repeat itself. That works until it does not, and BTC was very due for a real bear market type of correction late in 2017 with the chart being parabolic and not having deeper than a 50% pullback in so long. The longer a market stays in extreme overbought conditions without a meaningful pullback the greater the chance is for the market to change characteristics. By that I mean provide a longer more intense pullback. Some would say crash or bear market.
Parabolic by any reasonable definition
Does that mean we cannot continue to buy pullbacks? No, we most certainly can continue to trade BTC on the long side in these situations, but it is advisable to use stops, smaller positions sizes, etc. Keep in mind the majority of players in this space do not believe in stops. Being stopped out is painful but feels amazing when it saves a catastrophic loss.
ETH
Example of ETH support levels
Ethereum made a massive run in early 2017 followed by a massive 70% correction that so far has lasted 166 days. I love to accumulate within these long boring bases. The longer this base lasts the less likely a break below this base is. If/when this base breakouts a big run is possible. Buying at horizontal support is not flashy or super complex, but it is effective and gives great risk/reward. Buying breakouts is way more exciting, but has much worse risk/reward characteristics. I rarely buy breakouts. I am a pullback trader. I buy at support, or predetermined depth of pullback areas, based on analysis of previous pullbacks. A lot of coins build these lengthy consolidation patterns where you can set orders near the bottom of the consolidation for accumulating.
When a coin is trending, buying trend line touches is viable, but I don’t go as big on my position sizes the longer the run goes on. The first trend line touch can be a fairly large buy. ETH is a good example of what tends to happen after a parabolic move ends…
Stage Analysis
I have found stage analysis to be very valuable for trading crypto. It is a very simple concept to grasp. This blog is excellent for learning it. I use slightly different terminology. I use low level base, stage 1 base, and stage 2 base. If you continue reading my past trades, you will probably be able to pick up on how I use it.
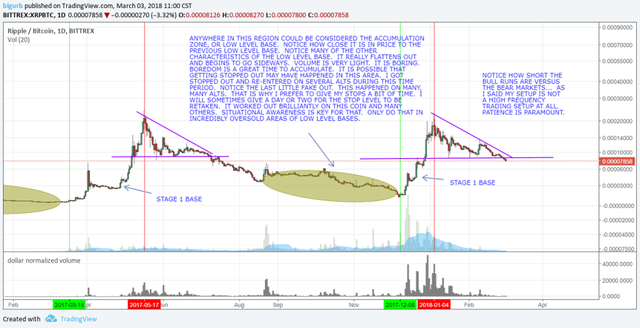
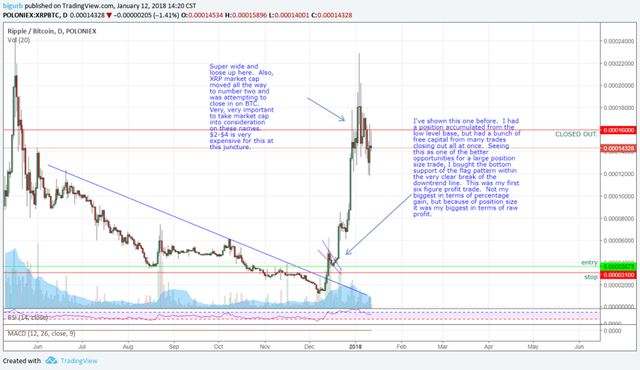
I am going to use XRP as an example for my version of stage analysis. I am not saying I endorse Ripple or like it’s fundamentals, but it does have a very well laid out chart that mirrors the alt runs VERY well.
Here are a couple of posts I made with some data about the length of bear markets for BTC and alt coins. It can help a bit with the perspective.
Alt Coin Trade Examples
The way I trade the alt coins is different from the way I trade the Big Two. The alts tend to have long periods where they underperform the Big Two. The larger alts can de-couple from the rest of the alts, and run at any time. They do not have to wait for the alt bull market to begin. NEO, IOTA, NANO are a few examples. The rest of the alts, particularly the small caps tend to run in sync most of the time. There are runners and fallers that de-couple here and there, but in general they run in sync. I define small caps in crypto as anything under #50 market cap on coinmarketcap.com. The small caps are where truly game changing returns can be made. Risk is much higher, buy if you employ a proper risk management system, you can mitigate the risk to some extent.
If you look at my Weekly Setups, you will see the alts that I am currently most interested in. It does not mean I own them or will be trading them. I actually do not trade my primary setup that often. My setup definition for small caps only provides a very narrow window of optimal entry.
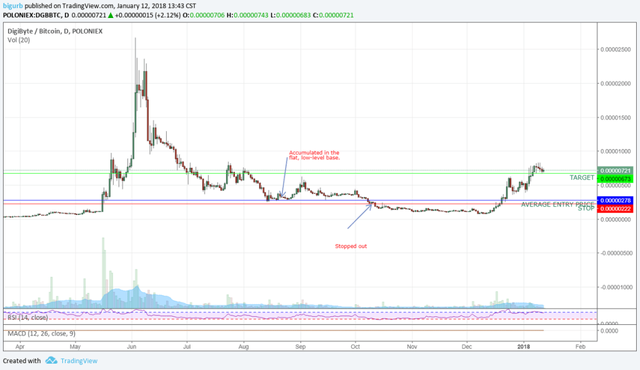
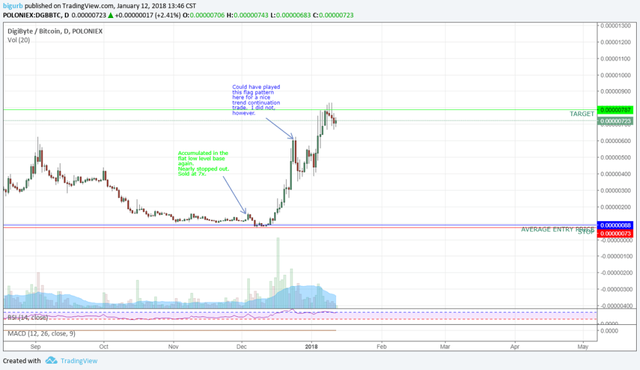
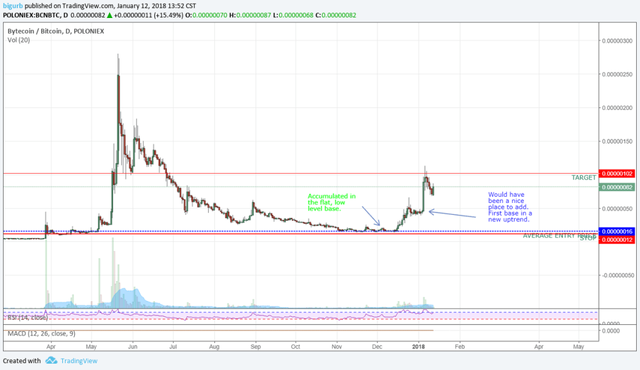
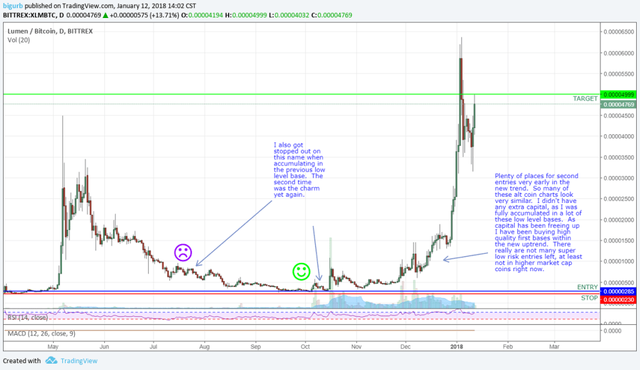
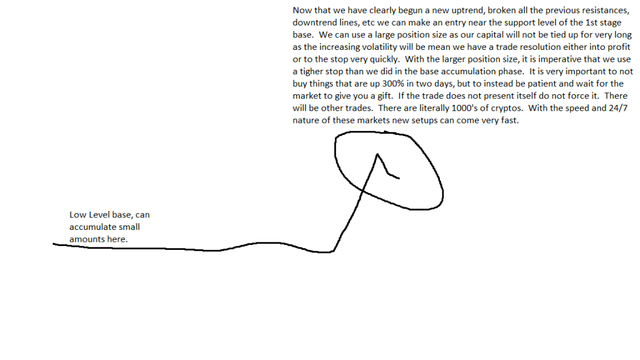
I try to accumulate within low level bases, but my absolute favorite place to enter is in the Stage 1 base. From here we have very fast trade resolution and massive gains if you can avoid getting stopped out. The low level base accumulation is great, but these bases can last a tremendously long time and become dead money to some extent. The stage 1 base is a place that trades tend to resolve quickly, and large position size can be entered here as the odds of the trend continuing in our favor are relatively high here.
The Stage 1 basing area is similar to Dave Landry’s First Thrust Setup. We are attempting to get in on the first pullback within a new uptrend.
DBG LOSS
https://www.tradingview.com/x/UhKoWqZC/
DGB WIN
https://www.tradingview.com/x/DrTpdhgO/
BCN WIN
https://www.tradingview.com/x/KdRz7b15/
XLM
https://www.tradingview.com/x/nIefdXTD/
XRP
https://www.tradingview.com/x/OWyGCcuC/
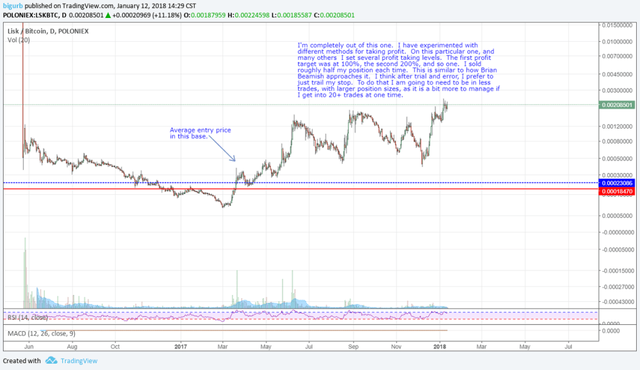
LSK
https://www.tradingview.com/x/bPUjf9qD/
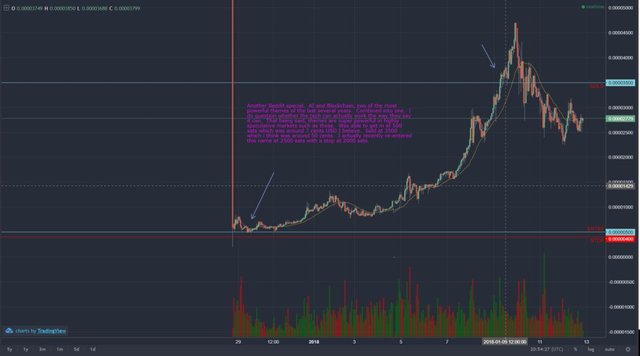
IOTA
https://www.tradingview.com/x/8GXz6Mb0/

DBC
https://drive.google.com/file/d/1nWkX6_XznlAD65HhIQTeneXe-wDgvYfI/view?usp=sharing
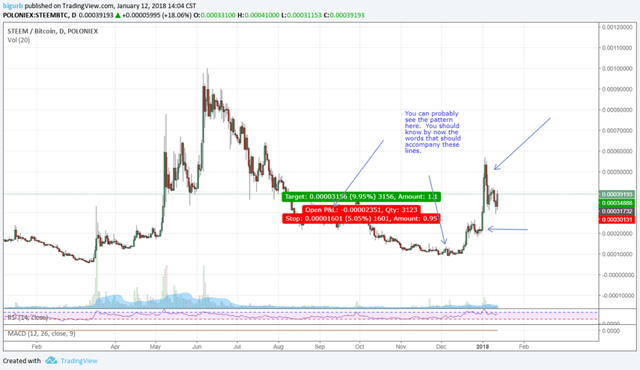
STEEM
https://www.tradingview.com/x/huRqo50C/
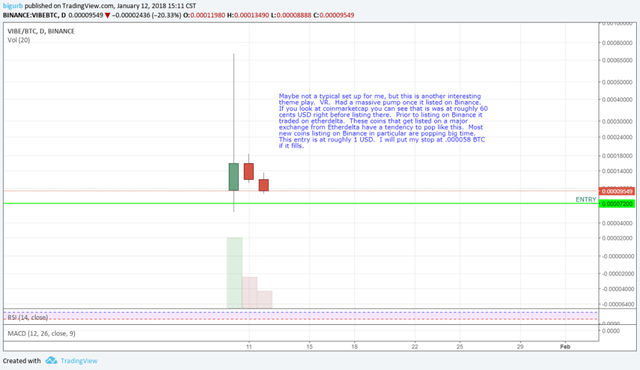
VIBE
https://www.tradingview.com/x/vxuibkrG/
This is a simplified version of my ideal trade setup..
Watch Lists
I cannot guarantee I will always update them or keep them public, but here are my watch lists. They will likely be posted in my Discord before the blog.
Stops
See my post on money management for an in-depth overview of setting stops in stocks. However, in crypto due to the enhanced volatility you do need to often use larger stops. In a nutshell, I always try to have at least a 2:1 risk reward ratio for my stops, though almost always my risk reward is much more favorable. So if my stop is 10%, my first profit target needs to be at least 20% though often it is higher. Now I try to not use greater than 20-30% stops whenever possible, because a vicious correction across the entire sector could wipe you out. 20% across the board would be tough, but better than 50-80%.
I want my stop to be at a place that it is unlikely to be hit. Below a very strong support level that is outside the normal volatility range of the coin. I eyeball the chart, measure the past pullbacks, and try to be below the depth of the majority of the pullbacks for the coin. This is not always possible, but this is the ideal scenario. I often will adjust my targets based on where my stop is placed. If I have to use a tight stop, then I am going to take profits sooner.
I will raise my stop as the coin moves up and reaches profit targets. Since I layer into a lot of trades, I will adjust the stop as my average price changes.
Targets
Targets are often set after stops. I do not always use targets. In fact, most of the time I do not. If I do my first profit target will be anywhere from 20-1000% depending on the chart. A chart that has a history of 100%+ moves I will be more prone to using a larger target. Obviously, if I am setting a 100%+ profit target I am not going to use a 50% stop. I almost always use much greater than 2:1 risk:reward ratios, just require that I have a minimum of 2:1.
I often times just trail my stop higher as the position moves in my favor, similar to the way Dave Landy does it. That being said, I do want to be in a trade that has the potential for large profit targets to be reached. So I will look at areas that profit taking could occur will consider that before entering the trade.
Be Routine Oriented
It is important to have a routine, to be organized to make maximum use of your time. There are LOT of cryptos now, and trying to find ideal setups can be like finding a needle in a haystack. Without great screening tools, there is some manual flipping through the charts that is required to find these. This isn’t a bad thing. It can greatly help you read charts. Looking at a lot of charts can only help you.
DAILY
- Go through the Coinigy alerts from the alerts placed on Binance and Kucoin. (I place alerts on every BTC pairing on these exchanges at the level I think a low level base could possibly form.
- Go through the screeners looking for setups (I have screens with Strymex and Tradingview where I attempt to simulate the Episodic Pivots screen.)
- Read various subreddits, watch YouTube videos, etc. of trusted sources. (This is a takeaway from Jesse Stine. He doesn’t screen for stocks, instead he lets the stocks come to him. There is some truth to that in my experience. The key is to be able to filter through the abundant noise.)
- Do Daily ICO Research. Set the post in the Discord server for details.
- Go through the weekly watch list looking for setups
WEEKLY
- Go through top 100 market cap coins. Pull up the chart in Coinigy. Would you buy it here? For me the answer is usually no. If the answer is Yes, or even if the price is close to a buyable level, then some research of the coin may be necessary if it has not already been done. Avoid obvious scams. Ask the pertinent questions:
- Does it need to be done with a blockchain.
- What other projects are doing the same thing and are they significantly ahead.
- Is the project solving a real problem.
Ideally, the project can answer a few of the questions. If not, that will not entirely eliminate from being trade-able, but it might adjust the position sizing. It is acceptable to go to reliable sources and see how they reviewed it.
- Make a watch list of the best setups. Set alerts and/or limit orders on the best setups if they are present.
- Make a watch list of the best ICOs from the ICO spreadsheets. Use a threshold of 80-90%+ rating. Add all of them to a watch list and check them post ICO. Look for buyable areas. Add good setups to the weekly watch list.
- Make a watch list of other interesting small caps. These can come from trusted sources. Go through this weekly looking for setups. Add good setups to the weekly watch list.
- Do weekly ICO research. See the ICO process flow post.
Short Term Trades
I occasionally take on shorter term mean reversion trades. For these I really just emulate quickfingersluc. Joining the slack group and using the various scanners available can help. I have modified this system fairly heavily. It will probably require a separate blog post to detail that system in great detail. Most of these coins cannot be traded with large size, so for me the big money has been made in the longer term trades.
I also will swing trade versus position or trend follow during bear markets or potential bear markets. I get a little tighter with my money management in these conditions.
The End
I think I have covered the crux of my crypto strategy. There is always a lot of nuance that cannot possibly be fit into a blog post. Any questions please ask. Also, join my Discord. There I post little details from time to time that can help fill the gaps. The best way to learn though is to get into the charts yourself. Start looking at the past pullbacks, look at where the next low level bases might form on small caps, where were some great stage 1 entries in the past, etc. Improve upon the system. Make changes as you see fit. Make it your own system. Incorporate elements of other systems as you see fit.
_Disclaimer
The advice provided on this website is general advice only. It has been prepared without taking into account your objectives, financial situation or needs. Before acting on this advice you should consider the appropriateness of the advice, having regard to your own objectives, financial situation and needs. Where quoted, past performance is not indicative of future performance.
SpeculateFreedom.com disclaim all and any guarantees, undertakings and warranties, expressed or implied, and shall not be liable for any loss or damage whatsoever (including human or computer error, negligent or otherwise, or incidental or consequential loss or damage) arising out of or in connection with any use or reliance on the information or advice on this site. The user must accept sole responsibility associated with the use of the material on this site, irrespective of the purpose for which such use or results are applied. The information on this website is no substitute for financial advice._