Response to Alexs1320
So on my previous post about this subject I got a comment from @alexs1320 where he asked for me to do a histogram of the distribution of the steempower amongst other items of business. So what I am going to do is provide the source code for actually doing it
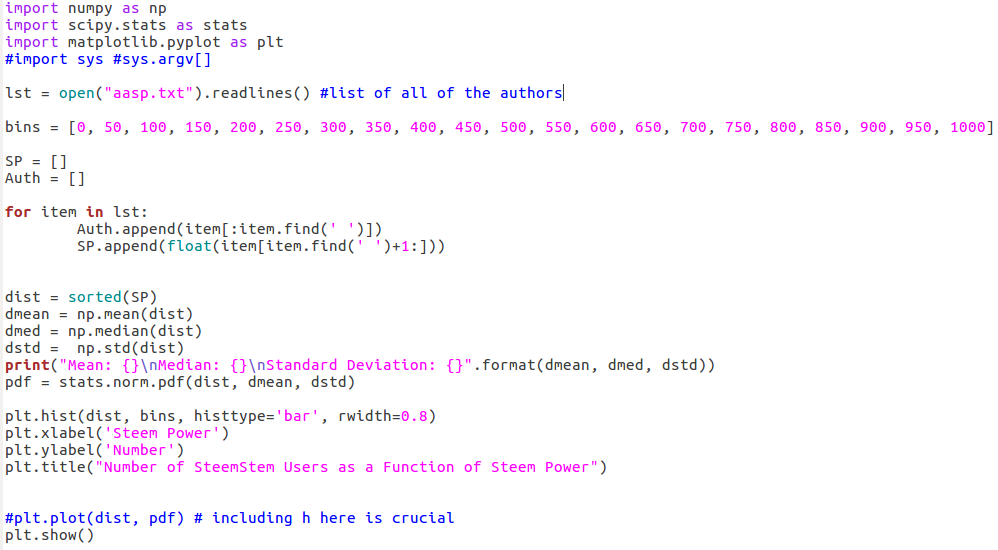
All of the analysis have been calculated off of variations of this code.
Mean: 1107.9996398406295
Median: 75.9322047099908
Standard Deviation: 5390.694061529243
Above is the output within the console and forthose without a background I will explain this briefly. The mean (average) is taken from the sum of all of the SP of steemstem community members (including curators) and dividing it by the number of members. Mean is also known as average. The median is the number that sits in the middle of the pack. So if you had a list of numbers (1,2,3,4,5) then the median would be 3. So if you have a high mean but a low median it can say a few things about your data depending on the situation. In our situation it means that half of the steemstem community members have less than 76 Steem power. Just for curiosity sake, the sum of everything before the median comes out to 7,407.754 SP and after that point comes out to 585,372.053 SP but lets show you guys something that better represents the information.
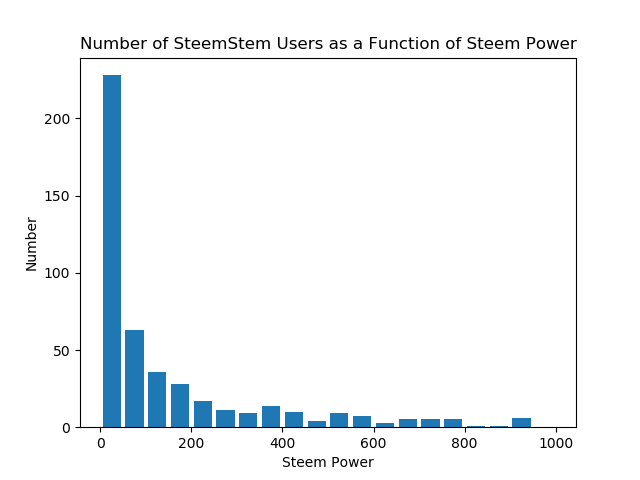
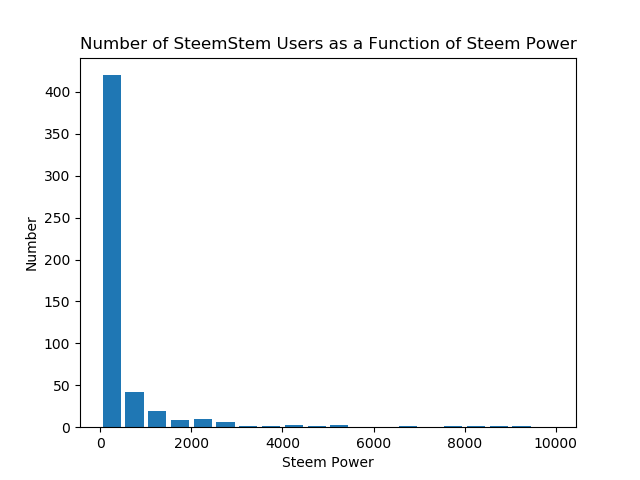
The first histogram shows the distribution of users in groups of 500 steem power, the second one shows the distribution in terms of 50 steem power. Now what that means (for the groups of 50 SP) is that all of the users with between 0 and 50 SP will be counted and tallied into the first bar, if they have between 50 and 100 then they go to the second, and so on.
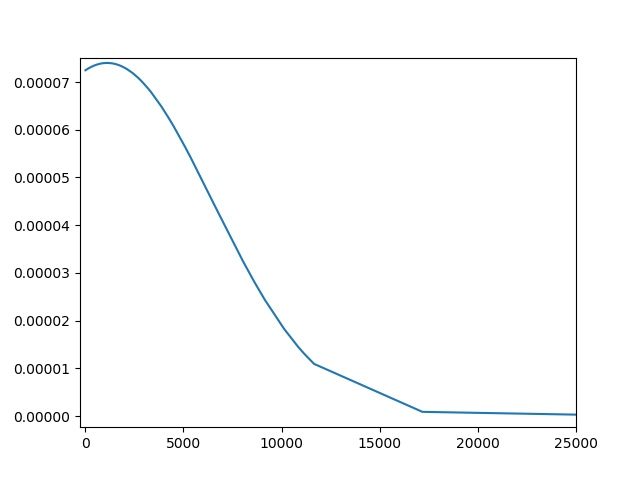
This, on the other hand, shows the normal distribution of wealth within the steemstem community. This is where we include a standard deviation of 5390.694 SP. What this means is that given a population (steemstem community) you can take the distribution of everything and it can give you some information. For instance, around 68-70% of the population will be within +/- 1 standard deviation of the mean. For this you can basically ignore the numbers on the left (y-axis) and just pay attention to the bottom. You see if we were to pick a person at random, the chance of them having 5000 SP or greater would equal to the area under the curve from x=5000 to infinity and the chance that they would have less than 5000 SP would be equal (in this case) to the area under the curve from 0 to 5000. I know that will mean nothing to non-math people but if you do like math then that will be an interesting fact. This is also a technique used for loot generation in video games along with many other uses. In other words, distributions hold an importance for statistics but most of us likely won't care about any of this.
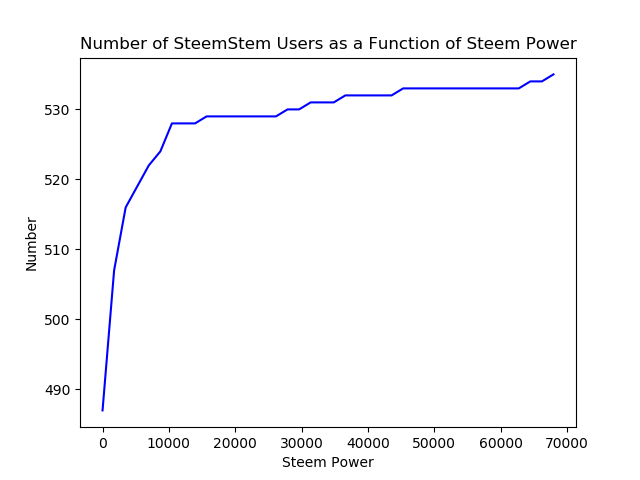
And this is the cumulative sum which has other probabilistic functionality like if you wanted to find the probability that someone has X steem power or less (if chosen at random) then the probability will be equal to the area under the curve from 0 to X over the area under the curve from 0 to the final value.
References
Data
All data has been received from the blockchain and the steemstem distilled posts.Libraries
numpy
steem-python
matplotlib
scipy
Information
Not going to lie, I didn't spend time looking for any specific resources here. I would but school is busy and this isn't exactly one of those posts that I am editing, writing and posting day of.
Wikipedia
Standard Deviation
Median
Mean
Normal Distribution
Histogram
Cumulative Distribution
Thanks! This is beautiful, simply beautiful.
This could help a lot to the community to understand the possibilities for the future strategy.
I'm not surprised that distribution has this shape.
Now that steemit is letting me comment again. I am not going to lie when I say I was not surprised by any of the shapes or trends in any of the graphs, I did however think that the cumulative distribution would have been a little more rounded before it started to plateau, so I guess i was kind of surprised that it plateaued so fast but otherwise I expected that after around 15,000 ish it would basically plateau.
If we put into the equation that we could make the interaction with (at most)40-50 people and that here we have 10 votes, it was to expect that there is the sharp cut for the top 30-50 authors.
I think that one of the key questions would be how to support the youngest in the most efficient way until they get the solid base of friends/fans.
My thinking goes like this:
Thus supporting them with 100 means 5 steem back
Average award league makes 1.5 - 5 % of "Other" votes.
To be honest, I expected the much greater difference.
I was trying to do something similar. I am really interested in doing analysis like these. This is some pretty good analysis
They are very straight forward to do. I might put all of the data into a google doc and link it in a later post so people can do their own testing upon it, however all of the data is already public technically so its not like I am stopping people form doing it by not releasing my data.
Yes I know.thanks for ur cooperation.....
@kryzec. This must be a tedious job for you to do.How ever well done.This information about how wealth is distributed among the community members is supposed enough to help us all, provided all information is within the permissible limit or acceptable quality limit.👍 @kryzsec
It actually wasn't very tedious, I mean I explained my process in response to dexterdev above and honestly anyone with the knowhow of using the steem-python library could easily do this and likely way more.
I just read your response to @dexterdev about how you got those data.well done once again
I was trying to do something similar. Let me know where you got the aasp.txt file. I am not able to see how you pulled out the data using python in the code. It would be helpful for me to know this. Thank you. The SP distribution seems to follow power law. Which means most of the wealth and power is with very few players.. like the usual wealth distribution in US, Russia, India or China. I am really interested in doing analysis like these. I would imagine that a really decentralized system will show a distribution as in Nordic countries.
So first I went through every steemstem distilled since january 14th and copied the list of names (as we list the names of people upvoted by both steemstem and curie)
After that I wrote a quick script that looked through all of the names and listed them alphabetically along with removing duplicates. Then I sent it to another script that downloaded the users account from steem (as shown in my previous post) and calculates their steem power, then it writes it to the file aasp.txt in the form of:
Then with the script I open it up and analyze it statistically. I could have wrote it all into one *.py file but because I wanted to keep the operations modular and didn't want to have to spend too much having to deal with handling command line arguments (and I do not want to redownload the profiles every time it runs) so I just keep separate files.
So I made the aasp.txt file.
Wealth distribution on steemit follows <a href="https://en.wikipedia.org/wiki/Zipf%27s_la>w"Zipf's law on application to an N-Person Prisoners Dilemma. I mean theoretically the wealth distribution will limit to an application of Zipf's law, it will not fit perfectly but still, I mean you are right that that has a logarithmic nature to it. A better read on that is the white paper located here but yeah.
Thanks for the detailed reply. I thought there would be some free python library where I can call users and get their wealth. Yeah otherwise it lot of manual work. I had a thought of pulling out all the users' wealth in steemit using a wild card call. I don't think it is easy. 😐. I have to read about the wealth distribution thing, specifically the n person prisoner's dilemma
There is. Steem python
For this program if we were to input dexterdev as the account and using steemd we can get the current Steem per MVest to be
489.859and the output would beThere, free code (as soon as you have the library installed to look at the wealth of anyone)
WoW.. I will try this. I may ask you some doubt later 😄.. thanks again. I installed the library. :)
the slope of the mean steempower could rise if members can dedicate 50% of their earnings on stem posts and power up,and follow the curation trail. This would be able to give a reasonable upvote worth even if curie doesn't give an upvote. This is some pretty good analysis
That would definitely do a lot for the community, I mean right now if we were to double the number of daily voted posts then we would basically have to half all of our votes and in order to provide the same rewards to users we would need the trail to double in power. I don't know the exact rate at which the trail increases in power but I do know its not greater than the growth rate of the community.
It's quite disheartening that majority only come for reward and not for the community growth.I believe that if we all join hands together, the community will become enviable on the steem block chain.