A really quick glance at Steem's inflation curve (with 2 new charts)
If the price of STEEM stays above $0.253 for about 9 more hours, we're going to see SBDs start printing again. As we've seen in the past, when that happens, the virtual supply starts to fluctuate more. Basically, when SBDs are not printing we're dealing with an upper boundary of the inflation curve, but when SBDs print, then the inflation curve can shift upwards or downwards.
So, normally, I have been just posting inflation updates quarterly, but with this possible shift coming, I thought I'd take a snapshot with today's values. I'm in a rush, so not much commentary, though.... I basically just want to have these graphs for future comparisons.
Figure 1: New Steem per day
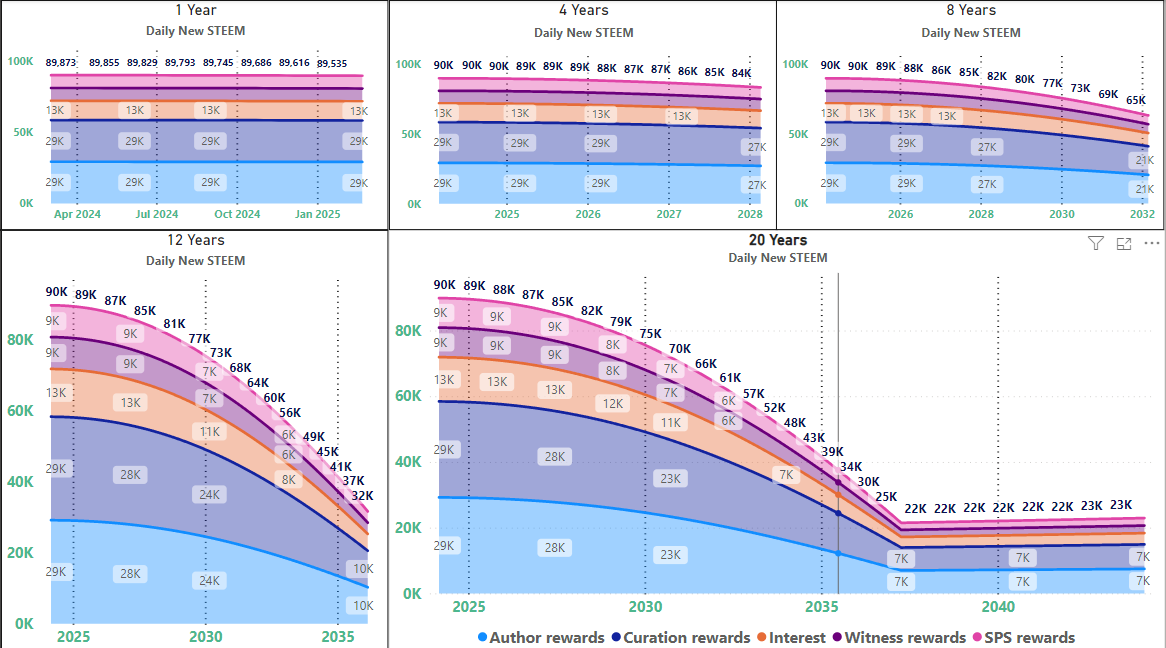
Key points here are that the past peak in new STEEM per day has been confirmed. The current expected value of new STEEM per day is 89,874, and all else being equal, it would be expected to decline from here on out.
Figure 2 (New): New STEEM per day / New BTC per day
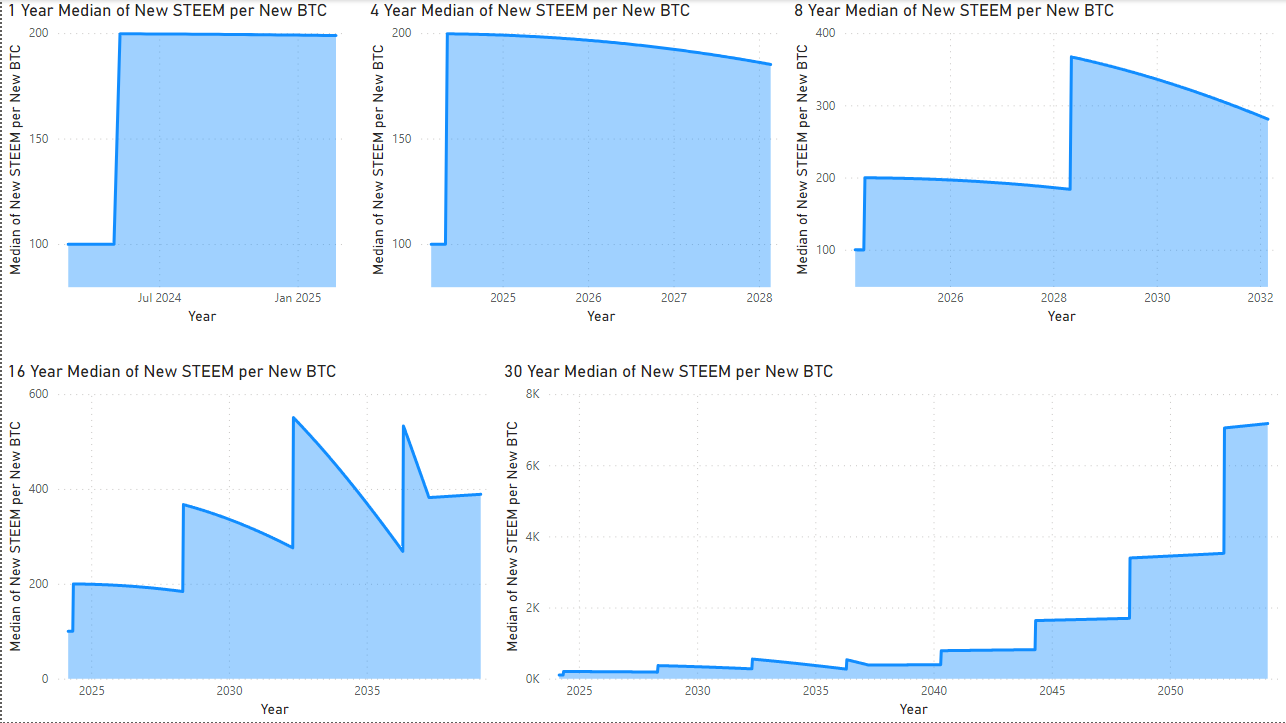
I was having a hard time imagining what this graph would look like, and now I know why. Until 2037, the ratio of (new STEEM) / (new BTC) declines in between halvings, but doubles instantly at each halving. After 2037, it increases slowly between halvings and doubles instantly at each halving.
Figure 3: Inflation curve and virtual supply
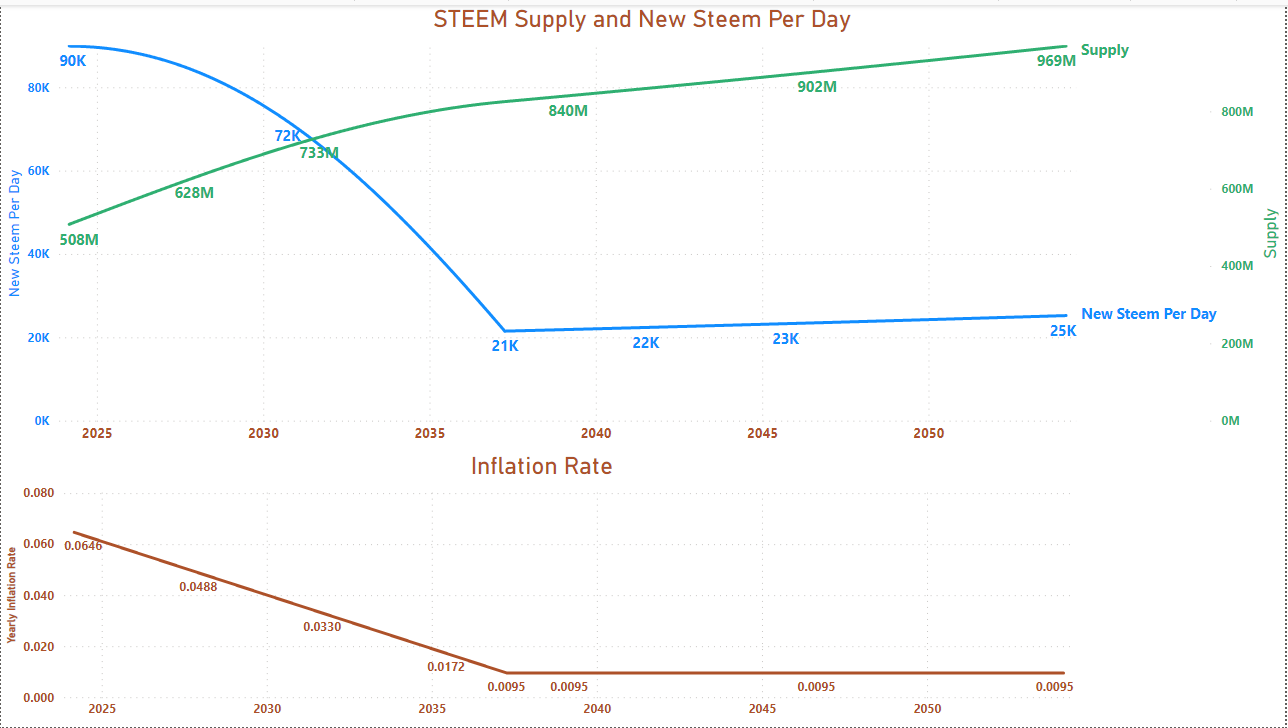
Nothing new here. Inflation rate declines until 2037, then stabilizes. The virtual supply growth increases at a consistently slower rate until 2037, then grows at a steady rate. It's already more than half of the expected value in 2054.
Figure 4: Past inflation
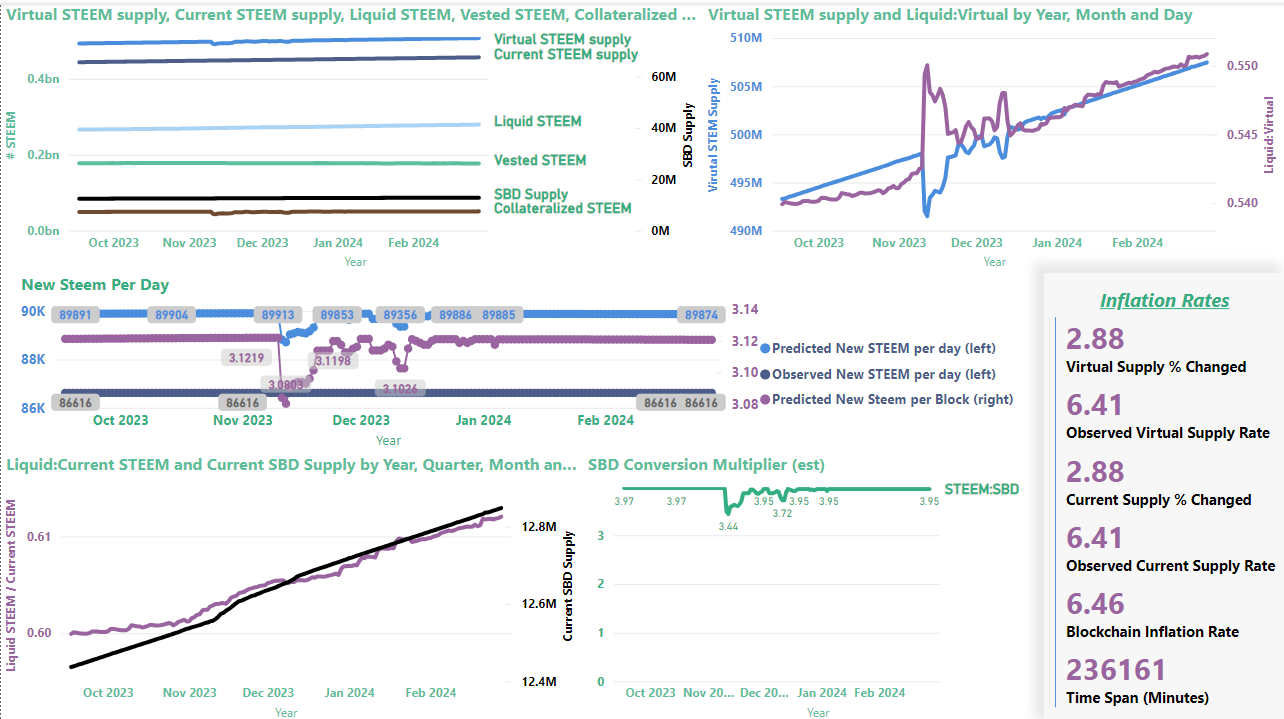
Key points here are:
- The expected new STEEM per day is 89,874, but the averaged observed rate has been just 86,616 per day.
- The expected inflation rate right now is 6.46% (and that has been steadily declining during the entire time frame), but the observed rate has been just 6.41%.
Figure 5 (New): Current and virtual supply changes
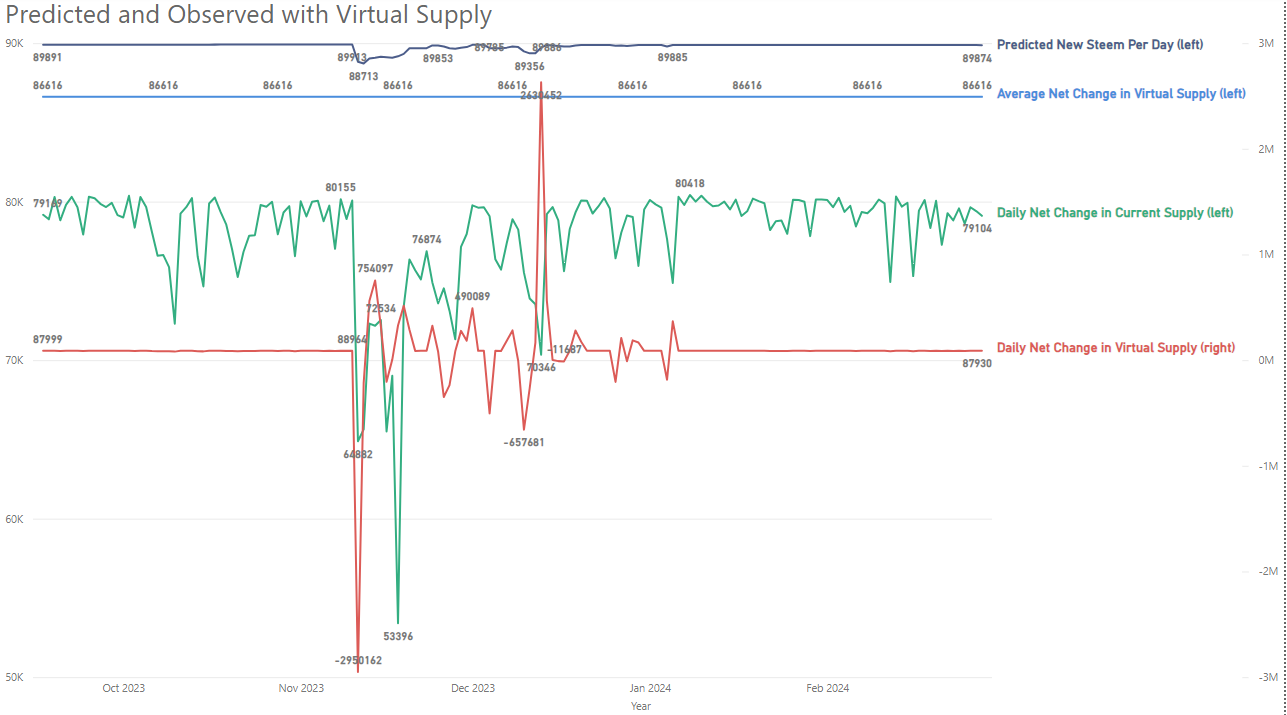
This is related to the middle bar in the previous graph, but I zoomed in and added in the daily change in the current supply as well as the actual daily change in virtual supply. It's important to note that when SBDs were printing, the virtual supply changed by millions, so the red line uses the right-hand scale, not the left.
- Again, this confirms the Nov. 10 peak at 89,913 expected new STEEM per day.
- The average change is identical to the middle row in the previous figure.
- When SBDs were not printing, the daily net change in current supply is about 10% below the virtual supply prediction (the 10% is due to SBDs flowing into the SPS, and any remaining difference is mostly/entirely due to token burning).
- When SBDs were printing, the daily net change in current supply was more than 10% off from the virtual supply because the SBDs that were distributed to authors did not add to the STEEM current supply
- Note the choppiness in daily virtual supply changes between November and January. That's when SBDs were printing. As the STEEM price goes up, the virtual supply goes down, and vice versa. The biggest decline was almost 3 million in a day, and the biggest increase was just over 2 and a half million in a day.
- If SBDs start printing again at or after 8am GMT tomorrow, I would expect to see that choppiness resume.
- Also, the higher the STEEM price goes, the lower the virtual supply goes, and hence the lower the predicted value for new STEEM per day. As noted above, 89,974 is an upper bound (barring exceptional circumstances), but it might go lower much faster than what we see in Figure 1.
That's it and I don't have time for proof reading so, "Let the reader beware". 😉 My main goal here was just to get the graphs up. I'll update the text as needed later.
Thanks for the analysis. SBD started to be given, but Steem is also given
Right, it needs to be above $0.282 for at least 42 hours before it would switch entirely to SBDs. Between $0.254 and $0.282, a mix of both gets distributed. (and those prices will be different in the future, since they're based on percentages of STEEM and SBD market caps at a given time)
Thanks for the detailed information. If Steem exceeds 0.280, it will already rise much higher. Of course, the price may decrease again. I haven't yet figured out the strategy of keeping the SBD price high and the Steem price low. In this way, steem inflation increases even more. They need to be aware of this.
This post has been featured in the latest edition of Steem News...
thank you for this cool information :)
You're welcome. I'm glad you found it to be useful.