How to Spot Pivots in Cryptocurrencies
Much like a stock, crypto currencies are driven by fear and greed.
And much like a stock, you need to be greedy when others are fearful, and fearful when others are greedy, as Warren Buffett would advise.
But how to we know when that happens?
One way is to use simple technical tools that pinpoint the exact moments that fear and greed are getting way out of hand. To do so, think of a crypto like a rubber band. We can only pull that rubber band so far before it snaps back and begins to revert to mean.
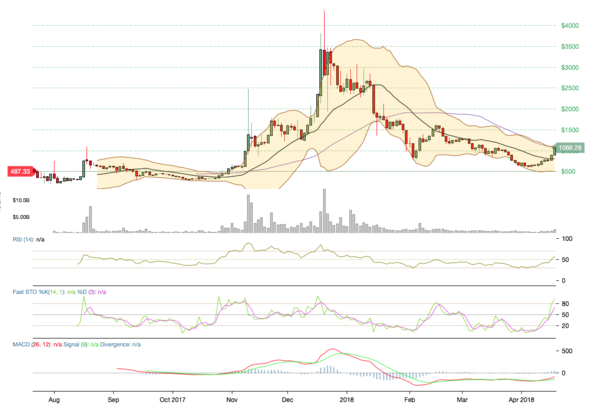
Look at a one-year Bitcoin Cash for example using:
• Bollinger Bands (2,20),
• Relative Strength (RSI),
• Fast Stochastic,
• Moving Average Convergence Divergence (MACD)
About 80% of the time when the upper Bollinger Band is hit or penetrated, confirmed with a move to or above the RSI 70-line, a move to or above the 80-line on Fast Stochastic followed by a spike in MACD, the coin begins to pivot and turn lower. We saw this happen in November 2017, December 2017, February 2018, and again in April 2018.
.png)
A lot of times we can call the bottom of a coin, too using the same indicators.
Notice what happens as the coin nears its lower Band with a move to 30 on RSI, confirmed with a move to less than 20 on Fast Stochastic followed by a dip in MACD. The coin begins to pivot and move higher. The most recent example of this was in February 2018.
We can see it happen with Ethereum Classic, too.
In fact, any time Fast Stochastic jumped above its 80-line over the last few months coupled with RSI at or near 80 with it at its upper Band, the coin pulled back. We can see this happen quite a few times since December 2017.
.png)
Then, each time, the coin was at or near its lower Band with RSI at or near its 30-line, confirmed with Fast Stochastic under its 20-line, the coin again pivots and moves higher.
Male sure that when you use these indicators that you always confirm your findings, and use multiple time frame charts. Typically, I’ll use a six-month, one-year and full historical chart to make a decision as to when I’ll buy and sell a coin based on fear and greed.
This is just one way to identify potential pivot points with cryptos.
Hi! I am a robot. I just upvoted you! I found similar content that readers might be interested in:
http://hidebox.org/mail/how-to-spot-pivots-in-cryptocurrencies-jaimiepiscitelli-2427681685