Tesla’s $480 Test: Will the EV Giant Power Through or Pull Back?

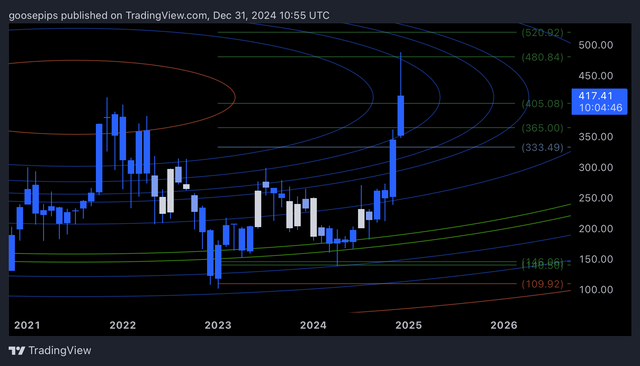
Tesla ($TSLA) has been on an electrifying ride, rallying over 40% in recent months. But as it approaches the critical $480 resistance zone, technical signals suggest the stock is at a decisive moment. By applying Fibonacci Circles, retracements, and key trendlines, we can uncover what lies ahead for Tesla as it battles to push past the $500 mark.
The Fibonacci Blueprint: Mapping Tesla’s Key Levels
Fibonacci retracement levels have always provided Tesla traders with reliable insights, and this chart is no different. Here’s how the current levels shape up:
• Resistance at $480: The 1.618 Fibonacci extension acts as the next major hurdle for Tesla’s rally. This level is also aligned with one of the outer Fibonacci Circle arcs, increasing its importance as a resistance zone.
• Support at $365: Should Tesla face rejection, $365 is the first key support level, aligning with both a retracement level and an inner Fibonacci arc.
• Critical Zone at $333: Below $365, the $333 zone provides a last-ditch support area before Tesla revisits lower ranges.
The Role of Fibonacci Circles: Time Meets Price
Fibonacci Circles add a time-sensitive layer to Tesla’s technical picture. The arcs represent zones where the stock is likely to experience increased activity, either as support or resistance. Tesla’s recent surge has perfectly followed the trajectory of these circles, with the current $480 zone acting as a point of confluence.
Breaking above the outer arcs could signal a continuation of Tesla’s bullish momentum, opening the door to $520 and beyond. On the flip side, rejection at this level may indicate a pause in the rally, leading to consolidation or retracement.
Bullish Case: The Path to $520
Tesla’s current momentum is undeniable, with a 40% surge reflecting strong investor confidence. A successful breakout above $480 would confirm bullish dominance and pave the way for $520, the next Fibonacci extension level. Beyond $520, Tesla could chart new highs, fueled by fundamental catalysts and technical alignment.
Bearish Case: Potential Pullback to $365
If Tesla fails to break $480, a pullback to $365 could be on the cards. This level has historically acted as a strong support zone and aligns with the Fibonacci retracement and inner arc levels. A deeper correction to $333 is possible, but only if market sentiment shifts dramatically.
Key Catalysts to Watch
1. Earnings Reports: Tesla’s financial performance will play a major role in confirming or invalidating this technical setup.
2. Market Sentiment: Broader market trends and investor appetite for growth stocks will influence Tesla’s ability to sustain its rally.
3. Fundamental Developments: Product updates, production numbers, and macroeconomic factors could provide the momentum Tesla needs to break through resistance.
Conclusion: Tesla’s $480 Decision Point
Tesla is at a crossroads. The $480 resistance level, reinforced by Fibonacci Circles and retracements, represents a critical inflection point for the stock. A breakout above this zone could propel Tesla toward $520 and beyond, while a rejection might bring it back to $365 or lower.
For traders and investors, Tesla’s next move will likely define its trajectory for months to come. Will the EV giant shatter resistance and continue its climb, or is a retracement on the horizon? Keep your eyes on the chart—it’s all about $480.