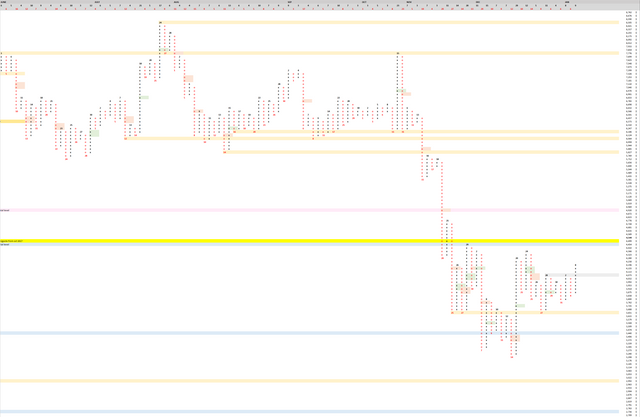
All eyes are (rightly) on $BTC 1-Day Inverse Head and Shoulders Set Up, not yet broken the neckline.
Point and Figure

Today we extended our column of X's to 9 X's. There are not any current long poles of X's (going back to July 2017). We are still in the range between 3,240 to 4,454.
Here are the recent long pole of O's, from the big wedge breaking down, which have not resolved 50%: 10/31/2018: 23 O's, resolves if price moves above $6,901. 11/15/2018: 19 O's, resolves if price moves above $5,885. 11/20/2018: 29 O's, resolves if price moves above $4,920. It could be a while before we see all 3 resolved, but I would be cautious shorting until at least the third is resolved with a price move above $4,920.
In my last few posts I recommended to hold your long on the 3-day timeframe. This long was taken when the 3-day RSI bull div confirmed. This is still the case for the same reasons: The 3-day RSI is still low (no set up for continuation bear div) and there is no sign of bearish momentum shift on any other nearby time frames (12h, 1d).
To take an opposing position for a moment, against the paragraph above: There is an argument to be made for closing the 3-day long just below the break of the neckline of the 1-day iH&S (described below). Then the long would be re-opened if the 1-day neckline breaks. I think this is a pretty intelligent strategy, but the obvious issue/question is where to enter the short hedge. I think it is cleaner to play the timeframes separately for now, and to 'double down' on your long if the iH&S neckline breaks.
In my last post I noted that the symmetrical wedge of the 4-hour has broken out so violently that we are at resistance again and it is best not to play that break out. Oh well. Patience is important. It is good to say 'dang the winning move was to buy the 15m break out' and sit on your hands as opposed to chasing the break out after it has already played out. But I did draw some FIBs thinking that if we pulled back to the 50-62% FIB it would not be too late to take out a long on the 4 hour chart: https://www.tradingview.com/x/PBEEwOG8/ But as you can see the price never came down to this area (green square). The market has been a bit more bullish than I anticipated the last several days. Sometimes this means missing entries, and that is OK. That whole play on the 4-hr is long since over now.
1-Day Inverse Head and Shoulders Set Up

All eyes are (rightly) on this set-up, although it has not yet broken the neckline. A close above the neckline on the 1-day chart would be a good entry for a long.
Congratulations @autemox! You have completed the following achievement on the Steem blockchain and have been rewarded with new badge(s) :
Click here to view your Board
If you no longer want to receive notifications, reply to this comment with the word
STOPDo not miss the last post from @steemitboard:
Thank you so much for sharing this amazing post with us!
Have you heard about Partiko? It’s a really convenient mobile app for Steem! With Partiko, you can easily see what’s going on in the Steem community, make posts and comments (no beneficiary cut forever!), and always stayed connected with your followers via push notification!
Partiko also rewards you with Partiko Points (3000 Partiko Point bonus when you first use it!), and Partiko Points can be converted into Steem tokens. You can earn Partiko Points easily by making posts and comments using Partiko.
We also noticed that your Steem Power is low. We will be very happy to delegate 15 Steem Power to you once you have made a post using Partiko! With more Steem Power, you can make more posts and comments, and earn more rewards!
If that all sounds interesting, you can:
Thank you so much for reading this message!
Congratulations @autemox! You received a personal award!
You can view your badges on your Steem Board and compare to others on the Steem Ranking
Vote for @Steemitboard as a witness to get one more award and increased upvotes!