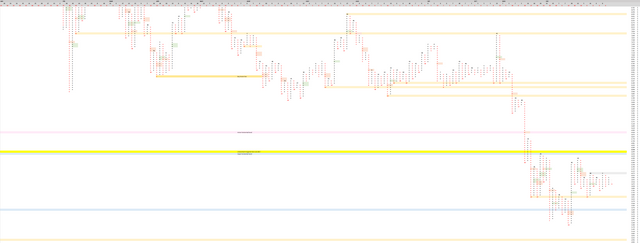
Point and Figure and a look at the symmetrical wedge on the 4h-1d timeframe on BTC
Point and Figure

Yesterday we entered into a column of 4 X's, and in 20 hours a column of 3 O's will confirm unless a new box of X's is reached. We have not had any new long poles since my last post. There are no more long poles of X's (since July 2017). We are still in the range between 3,240 to 4,454, although argument could be made we have a tighter range now of 3,651-4,073.
Here are the recent long pole of O's, from the big wedge breaking down, which have not resolved 50%: 10/31/2018: 23 O's, resolves if price moves above $6,901. 11/15/2018: 19 O's, resolves if price moves above $5,885. 11/20/2018: 29 O's, resolves if price moves above $4,920. It could be a while before we see all 3 resolved, but I would be cautious shorting until at least the third is resolved with a price move above $4,920.
In my last post I recommended holding your long on the 3-day timeframe. This is still true for all the reasons written there.
Tight bbands on 4h-1d timeframes with a sym. wedge on 4 hour

Here is the 4 hour chart with all the classic signs of sym. wedge. This classic wedge creates a good opportunity to play both a break out up and downward, although I would argue that a break down is more likely to fail because our higher timeframe (3 day) still has bullish momentum in play (3 day RSI bull div). For a 4-hour timeframe play, I would short or long the break of the wedge, taken at the a close on the four hour above or below the teal/orange lines. It would be tempting to use the 2 hour, especially with such a clear wedge. I think 4 hour will suffice though- it is safer. The wedge is also visible on 6h-1d timeframes so the 4 hour is actually fairly lower timeframe for this wedge. The break is more likely to be successful if it happens on monday. Weekends tend to go back to friday close by tuesday.