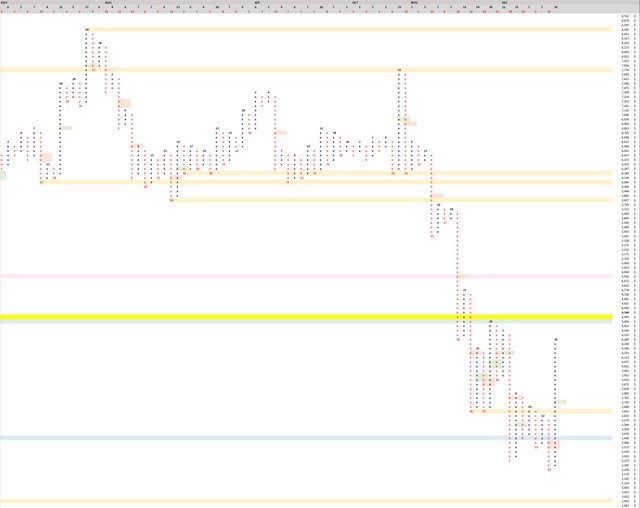
Point and Figure for BITCOIN and a look at our 6-hour RSI Bear Div
Point and Figure

We have formed a long pole of 15 X's. A 50% retrace of this pole would put us below $3,762. We are at the top of the current range: 3,240 to 4,454 (3 boxes from the top, or 10% from the top).
Here are the recent long pole of O's, from the big wedge breaking down, which have not resolved 50%: 10/31/2018: 23 O's, resolves if price moves above $6,901. 11/15/2018: 19 O's, resolves if price moves above $5,885. 11/20/2018: 29 O's, resolves if price moves above $4,920. It could be a while before we see all 3 resolved, but I would be cautious shorting until at least the third is resolved with a price move above $4,920.
3-Day

My last post was at the close of the 3-day, which confirmed a 3-day bear div which is still in play. I gave a strong buy recommendation. I hope you found your long entries.
6 Hour RSI Bear Div signals some relief for bears

On the lower timeframes we see some signs that we are due for pull back downward. This doesn't mean the 3-day bull div has played out, it is just normal signs of mean reversion. It will be difficult to make the higher high above 38% fib at $4,488. Downward movement over next 12 hours is likely.
TLDR; For those who bought the 3-day bull div, you can hold that long position although short timeframe looks like bears will be getting relief.