Point and Figure for Bitcoin and Analysis
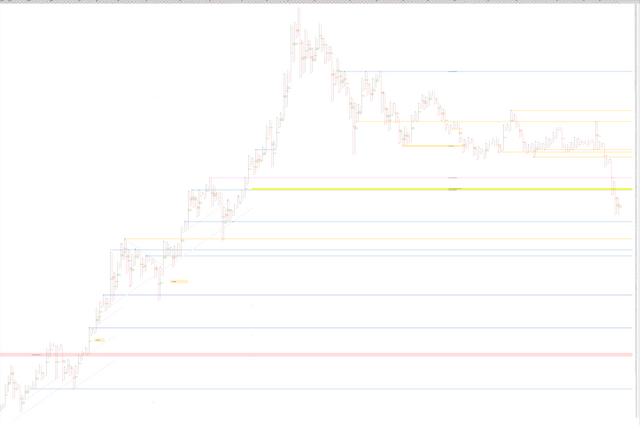
Point and Figure  I thought it would be interesting to some to post a 2 year point and figure, sorry it is pretty large. You can see we have resolved the long pole dating back to october 2017 by breaking $4,544. I made a lot of speculation that this would happen a long time ago because retracing this pole would also mean coming down 80% from ATH. A
As a true believer in BTC it was sad to see it happen. I am just glad that our 3-day closed very shortly after break out from the wedge. I was committed to not shorting until the 3-day confirmed the break down (per my previous posts) and it worked out really well with timing.
Going back to the Point and Figure chart... We have 3 unresolved poles of O's, all from this month. 6,833 must be reached to retrace 50% of pole of 23 O's dating back to Oct 31. 5,827 must be reached to retrace 50% of pole of 19 O's dating back to Nov 15. 4,872 must be reached to retrace 50% of pole of 29 O's dating back to Nov 20.
Lower timeframe divergence cascade on $BTC will end with a 12 hour divergence, confirms in 1 hour:  I would like to see a bull div on 3-day or weekly before long term longs are opened, but this could be a signal to close your short or do a short term long (maybe close it at the top of my pink range, which is based on horizontal levels and volume profile). I don't usually see divergence across RSI, macd, macd histogram, and accumulation/distribution all at once... but it doesn't really matter much... I mostly only watch RSI and keep the others small at bottom of my chart.
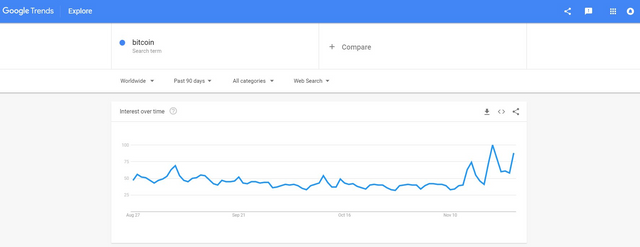
BTC google trends pick up with volatility.  Attention is good for bulls long term. As we touch down on 80-85% from all time high, those who took the short on our big wedge break down should think about taking profits at the lower of this range (pink):