RSI Strategy Statistics - from TraderBot Marketplace LLC Research Analytics - Nadex - Cantor Exchange
Quite often, you will hear traders spew absolute garbage like “ Buy when the RSI is below 30.”
This is not, has never been, nor probably never be a great strategy. It has nothing. It has no time context and no price context. What if there was a way to see how profitable this strategy was?
There is! Its called the Probability Tool Suite. Below, I have compiled just a few things you can see....
How often does RSI expire profitable?
Asset = EURUSD
Type = Binary Options (Nadex & Cantor Exchange)
Strike = ATM (At the money)
RSI Chart = 5 Minute Chart
RSI Expiry = The top of the hour
Period = 14
Long Only
Buy when 5 minute bar closes below 30.

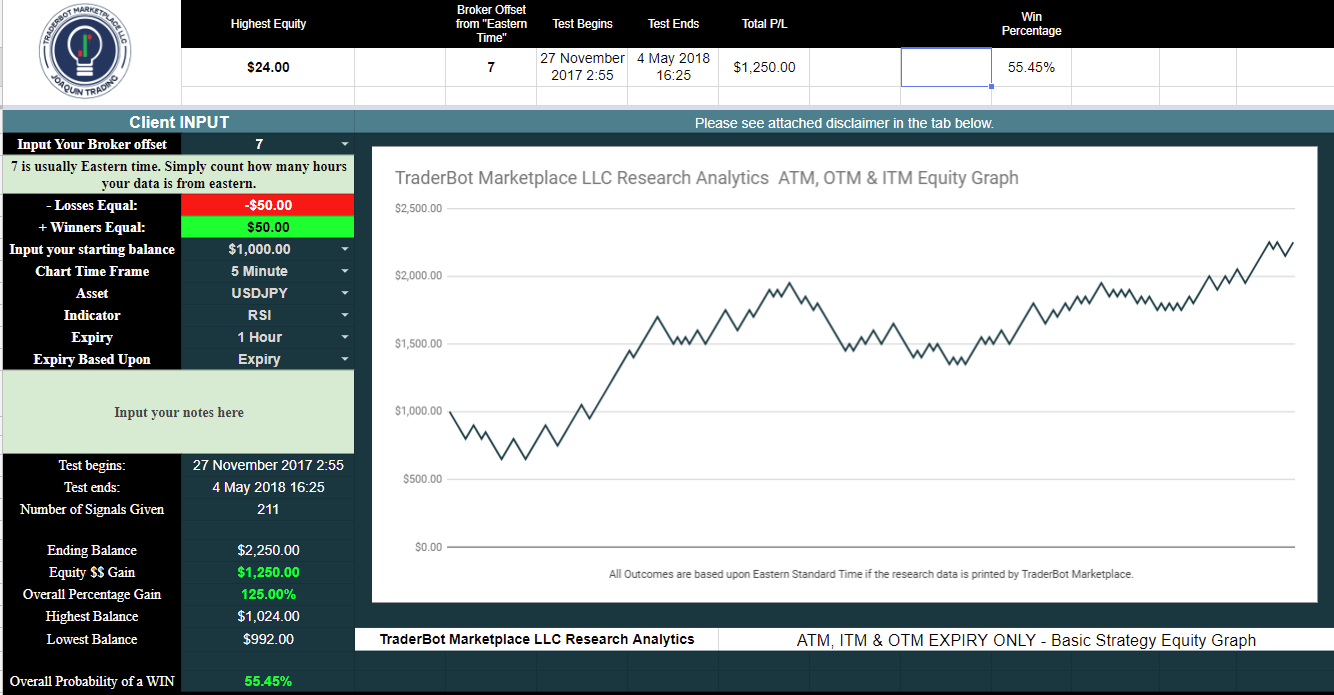
Some may say, " Wow! That is profitable!", however I beg to differ. Take a look at the percentage of time it is profitable. It says 55.45% of the time this trade would be profitable.
This part is 100% spot on true.
What's not true is this being a profitable system AS IS. You are never going to be able to get a binary for $50 and take a loss of $50 on every trade. This is impossible, due to the spread that the market makers charge.
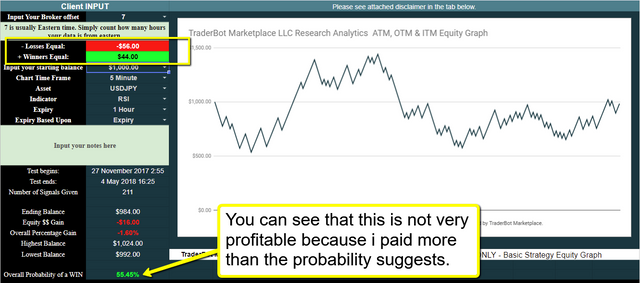
On this strategy, you will be lucky if you get $54 on every trade. Let's slap on another $2 onto each trade (commissions) and now lets see how profitable it is.
We will be risking $56 to potentially make $44 (Which is realistic).

Welp! That just sucks, now dont it?
The very next time someone says that the RSI is a good buy at 30 outright, ask them about the time frame and all that. You can then prove them wrong in about 3 minutes.
But what about ITM Equity curves?
Ok so you want to see an equity curve if you took a binary, say 10 pips ITM?
Asset = EURUSD
Type = Binary Options (Nadex & Cantor Exchange)
Strike = 10 Pips ITM (It the money)
Risk $80
Reward $20
RSI Chart = 5 Minute Chart
RSI Expiry = The top of the hour
Period = 14
Long Only
Buy when 5 minute bar closes below 30.

Oh Wow! Now THAT'S something I wanna learn more about!
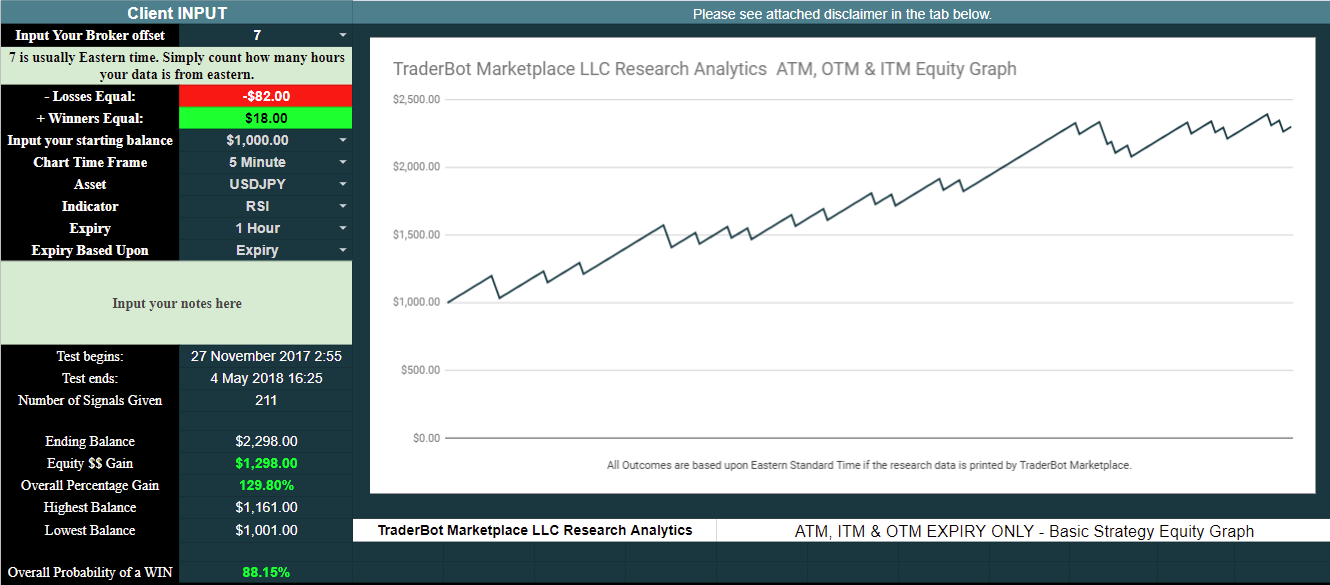
That strategy was simple buying an ITM strike as soon as the signal came out and letting it expire. You are paying $80 for it, in the hopes to make $20 but after a couple of bucks are shaved off for commission, you are left with paying $82 for a potential reward of $18.
The RSI strategy IS profitable this particular way.
Don't just take other peoples word for it. DO your own research. Now that we have released this spreadsheet, you can check.
Let's Take a look at one more before I leave you for the weekend...
Asset = EURUSD
Type = Binary Options (Nadex & Cantor Exchange)
Strike = 10 Pips OTM (Out of the money)
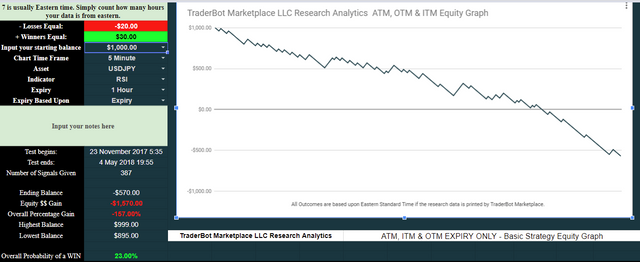
Risk $20
Reward $30 (touch. We will take profit if price touches the strike.)
RSI Chart = 5 Minute Chart
RSI Expiry = The top of the hour
Period = 14
Long Only
Buy when 5 minute bar closes below 30.

Tell me again that simply buying when RSI is below 30 is a good idea ;)
