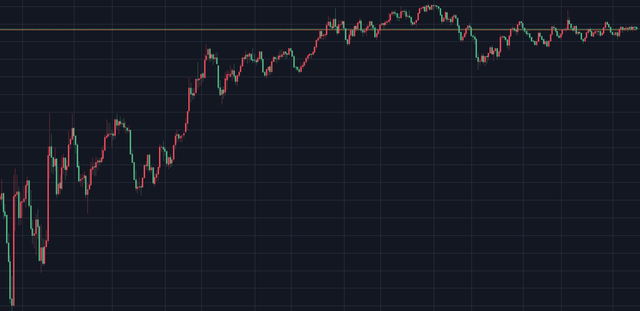
How Would You Trade This Chart?
I'll pick one comment below pay 5 Steem Dollars to promote your next steemit post if you guess the right trading strategy to this chart:
I'll pick one comment below pay 5 Steem Dollars to promote your next steemit post if you guess the right trading strategy to this chart:
Looks like the upward channel has broken, but then found support at the lower green line.
I would enter this trade as the price breaks above the top green line, using the lower green line as a stop loss. Ideally the price would follow the pink arrows. Keen to hear the outcome!
I am trading this market as though it is a 1-2-3 trend change formation, and have my position for the market moving opposite to your prediction... the jury is still out - this is a chart from an actual market and there is no answer yet.
Interesting... which market? I'd like to follow along.
This is a trick question because it is actually the weekly bars for silver prices, but the chart is upside down. It appears my position has been proven correct and that is a good thing because I have a 10x leverage position with 0.3 bitcoin! Will keep you posted when I take profits.
I would not trade it until the equilibrium pattern breaks. Bear break is an oversold bounce opportunity. On a bull break one could stop buy in or place a market order. Most important rule.....always set a stop loss on trades!
I am bad for not using a stop loss, but really good at closing trades that have not proven me correct. As for this chart, I have a 10x leverage position a little bit in the profit, and awaiting to see if the market moves for me or against me. I am betting on this chart being the moment of the trend change - and keen to see how it plays out as well.
What are you trading? What's the ticker? You have me interested now;-) Good luck!
I have to reveal - this chart is upside down. And it is the weekly bars over the past few years of prices for... SILVER! I am trading world markets on 1broker - rather than just trading alts to grow my bitcoin.