You are viewing a single comment's thread from:
RE: 📈STEEM Investor Report 30 June 2017 (Broader Market Uncertainty, STEEM Winding Up)
The below chart shows the pricing pattern in BTC/STEEM. The yellow circle shows the last time we experienced extremely low volatility, declining volume, low momentum indicators and sat below the simple moving average at the same time.
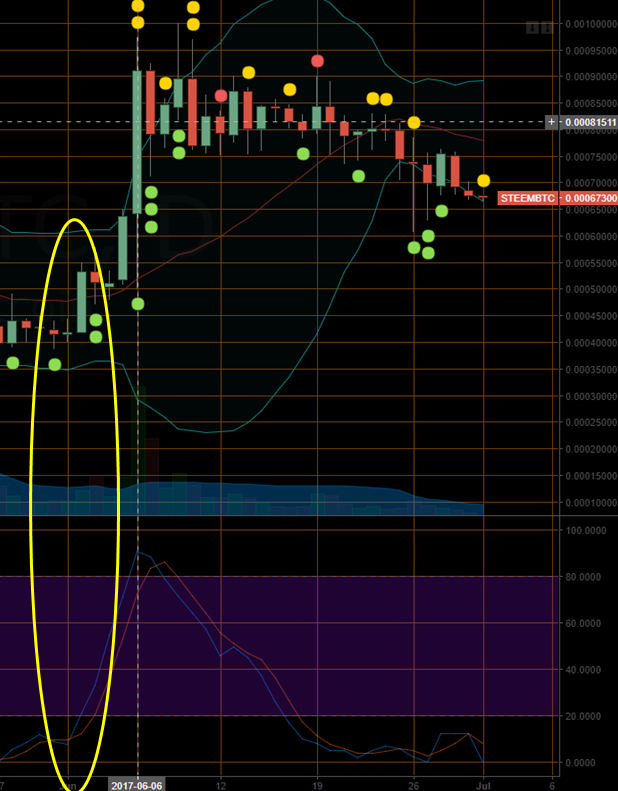
Thanks! It definitely looks poised to make some kind of big move as it pushes out of the BBs at the bottom there.