Trade alert: getting back long precious metals (multiple trades)
You may have seen my original analysis of the recent gold and silver breakout of multi-year trend lines, here. I recommended getting long via JNUG, as the metals themselves were slightly over-bought and JNUG had put on a nice pattern.
Today, that trade was stopped out (by 1 cent!) and reversed back up again to close on the high on the day. Now, hard as that may be, today's price action only strenghtened my original case. The pullback has refreshed JNUG and PMs and may allow a new move higher. If prices continue to rise tomorrow, we are going to reenter that trade.
I also have another related trade recommendation. But first, JNUG.
Trade 1: buy JNUG
Today, the prices returned to the top of the trading range and closed on the high, showing further support at this level. The momentum remains bullish and the pull back over the last few days may be what was required to refresh the move.
Buy (stop order) JNUG @ $23.21
Stop @ $21.79
Target: Not setting a target for an order, but you can get an idea here
Once we are in, we will keep a wide stop to try to catch as much of a potential very big move as possible.
Trade 2: long spot silver
As I mentioned above, precious metals as a whole had a good day. Both gold and silver fell lower before reversing back into their recent bullish trend. However, gold is still quite over-bought, and is sitting at 2017 highs. Silver is still below its 2017 highs and typically moves with more volatility than gold. I believe if there is more room to go in this recent move, that room lies with silver.
I present below some interesting charts of the Gold:Silver ratio. Firstly a long term chart:
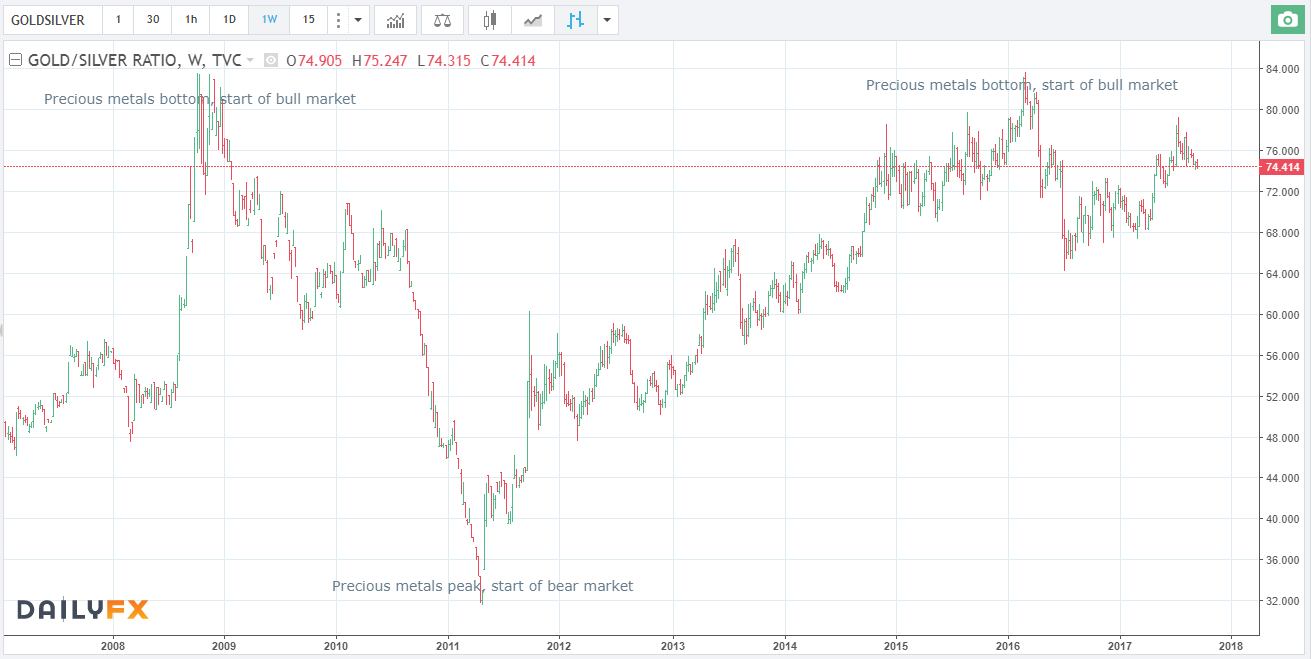
It's interesting to note that peaks in the Gold:Silver ratio correspond to bottoms in the PM markets. This is understandable as silver moves with more volatility than gold. You can see the another peak in this ratio has been forming over the past couple of years while both gold and silver have been forming a new bottom. Now if we look more closely at recent prices in this ratio:
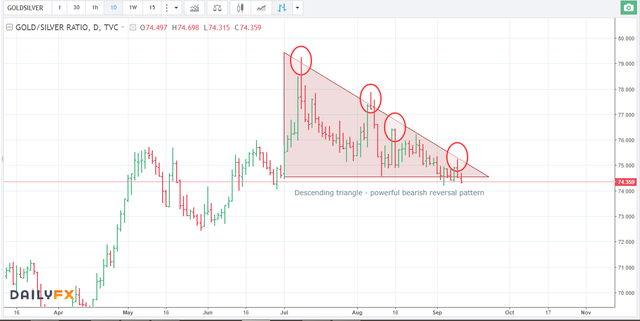
The daily chart of the ratio shows that a descending triangle has been forming since the recent July PM low. This is a powerful bearish pattern and indicates a likely decrease in the ratio, corresponding to an increase in silver price, relative to gold. The red circles represent strong rejections and sell offs at the top of the descending triangle and strenghten the case. Therefore, if the PM bullish trend is to continue, I prefer to be long spot silver. Interestingly, an decrease in this ratio also indicates a rise in the prices of both gold and silver. If prices continue to rise tomorrow, I want to be long.
Buy (stop order) Spot Silver @ $17.92
Stop @ $17.67
Target @ $18.51 (this corresponds to the 2017 highs and may be moved higher)
Reward to risk ratio: 2.4
Bonus trade: long spot platinum
I like this trade for similar reasons.
Buy (stop order) Spot Platinum @ $992.10 (prices from IG)
Stop @ $981.5
Target @ $1036.30 (this corresponds to the 2017 highs and may be moved higher)
Reward to risk ratio: 4.2
If the trade entry is triggered, the stop loss will be adjusted as the trade progresses and our position may be closed early based on price action. Please pay attention to your risk management - I recommend not to risk more than 1% of your account per trade. Note that these three trades are correlated so you may wish to reduce your risk for each trade.
What do you think?
Thanks for reading, any feedback is much appreciated!
Follow me for updates, management of this trade and more trade alerts!
Disclaimer: These are my ideas only and do not constitute investment advice. If you place any trades listed here you are doing so at your own risk and I hold no responsibility for any losses. Please pay attention to your risk management.
Just been stopped out of the silver trade. The other two weren't triggered. May look to get short if things stay as they are later.
Today's action did give me a similar thought. I went short the mining stocks last week, added to that on Monday and went way overboard yesterday morning. I closed most of my short positions yesterday afternoon, but maintain my original short position. I think the fast stochastic, the slow stochastic and MACD all indicate there is some more downside in the HUI. But certainly the idea that this current action is a consolidation rather than a reversal is on the table. A Fall rally in precious metals, now that is something to think about. Good analysis and thank you for sharing.
Thanks for the comment. Friday and Monday were great days to short the miners. I'm in two minds about this and can see an argument for both bullish and bearish. But have to test out the upside after today's signals. Check out the potential inverse head & shoulders in the comments (forgot to include that in my original post). That's also something that made me want to try for a further move in silver.
I absolutely can see that. I am also of two minds on this, I was of one mind, short, until yesterday's action which gave me pause. The greatest thing about trading is I do not have to be a Bear or a Bull, I can be what the market tells me to be.
Exactly!
Thanks for the insight. Now following
Thanks for the support.
Forgot to mention:
Today may have been a successful retest of the neckline of an inverse head and shoulders pattern for silver.
Bit of a dodgy IH&S but definitely some support there. The left shoulder may be a bit closer to the head and the neckline lower, but may still power a further move higher in silver.