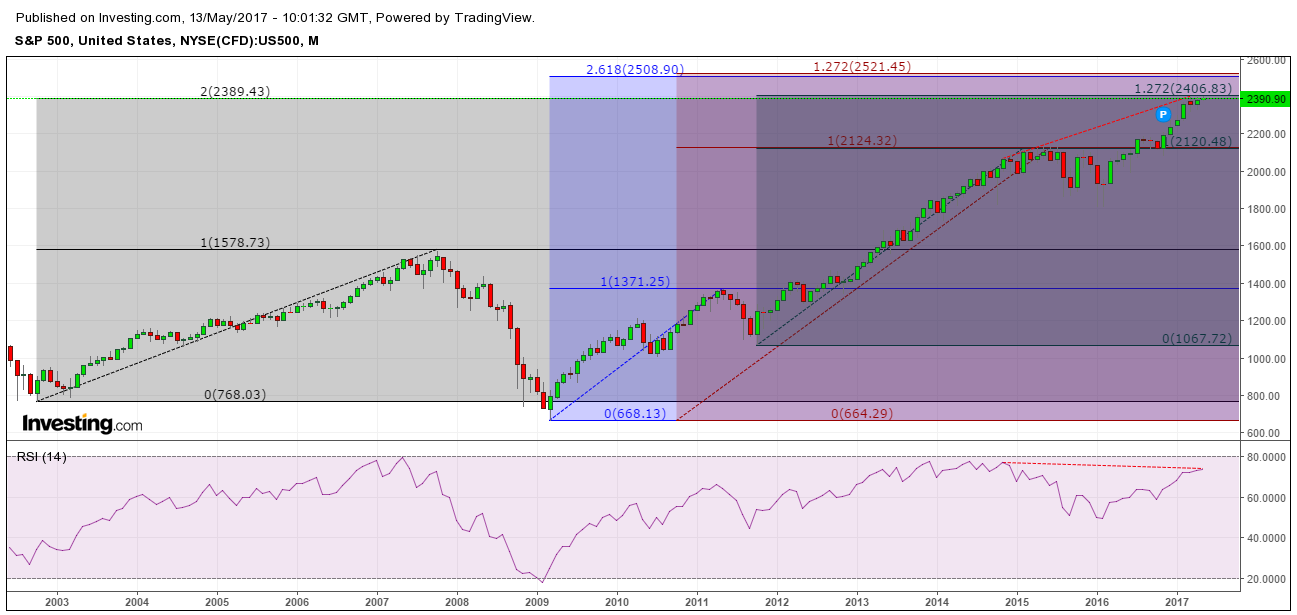
S&P 500 monthly chart WARNING SIGNALS
Look at this monthly chart and tell me what you think.
I have drawn 4 FIBONACCI extensions as well as the PRICE and RSI divergence.
What are the odds of the market going higher or lower?
Right click on the image and "open image in new tab"