Trade Setups I am watching for week starting Aug 1st
I wanted to share a few trade setups that I am watching into this week (08-01-16).
The majority of my setups this week focus on USD pairs, so I typically start by glancing at the Dollar Index for a big picture view.
Where the Dollar Stands:
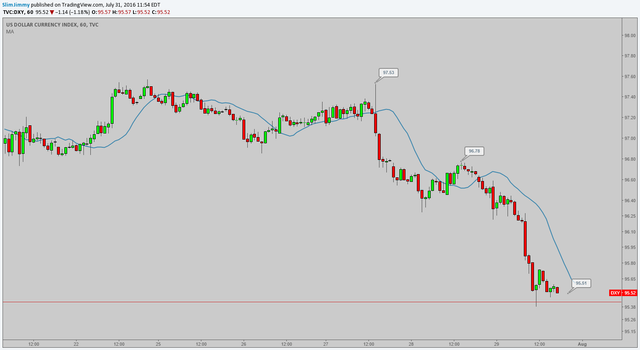
DXY (Hourly)
The USD took a beating over the past week over poor trade numbers and durable goods orders.
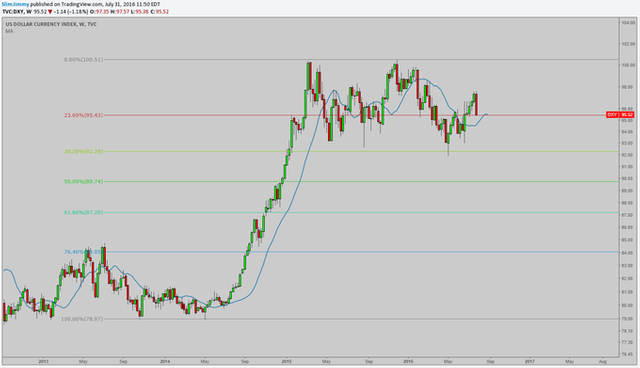
We may see some relief here as we find support at a key fib level on the weekly chart, however this has been a relatively weak level over past months, and key event risk in the coming week may result in the dollar falling right through this level with little hesitation.
Setup #1 : AUD/USD RBA Trade
I’m expecting some big moves on this pair over the next week. As we see on the daily chart, the Aussie Dollar has been trying for some time to buck a long running downtrend. It is now positioned in a choppy but historically strong resistance zone and up against a key fib level.
AUD/USD (Daily)
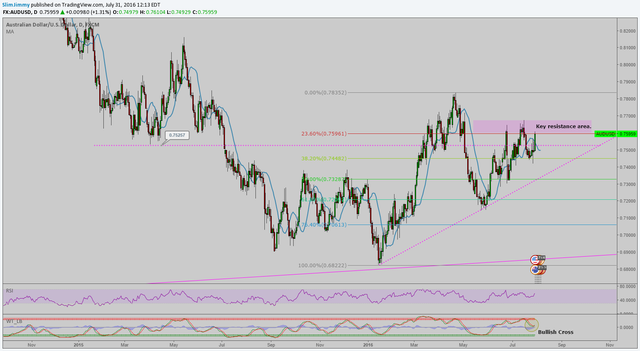
However, with a rate decision coming from RBA on Tuesday, I’m not counting on any of the technicals to hold on this one. Last week the markets were predicting a 70% chance of a rate cut by 25 basis points. Going into the weekend however, the market is pricing that likelihood at a rate closer to 50/50 due to strong economic data coming out of Australia.
If the RBA does leave the rate unchanged, look for price to blow past this resistance, and a healthy extension upward to the next resistance level (roughly around 0.78200)
If the RBA lowers rates, expect the aussie to give back the lowered expectation it priced in over the last week.
I’ll be looking to short from 0.75565, down to the trendline or 0.5 fib level (green line). See below chart for exact setup.
Note: Be aware of choppiness that could result from ISM report from the US on Monday. I won’t be taking any position until after this report.
AUD/USD (4 Hour Chart)
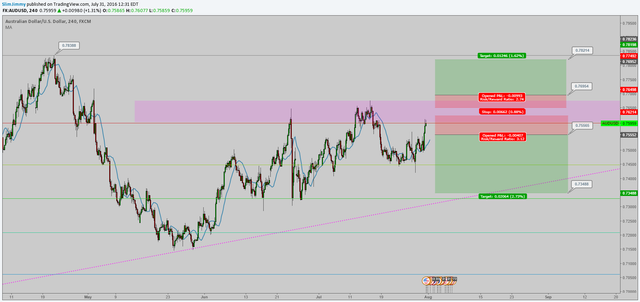
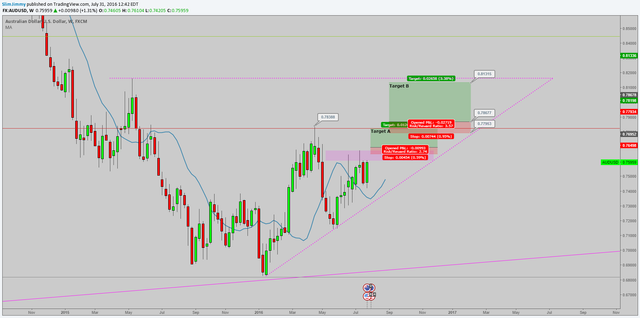
If the bank does leave rates unchanged, and we reach the longside target, I will wait to see how price reacts around the previous high of 0.816, which also coincides with a nice fib level on the weekly (see below chart).
If we see a sustained break above this level, I’ll enter another long position with a tight stop and a target near the top of wedge at around 0.81315.
This one could turn into a multi week trade.
AUD/USD (Weekly Chart)
Setup #2 : NZD/USD Short
This one won’t be nearly as in depth.
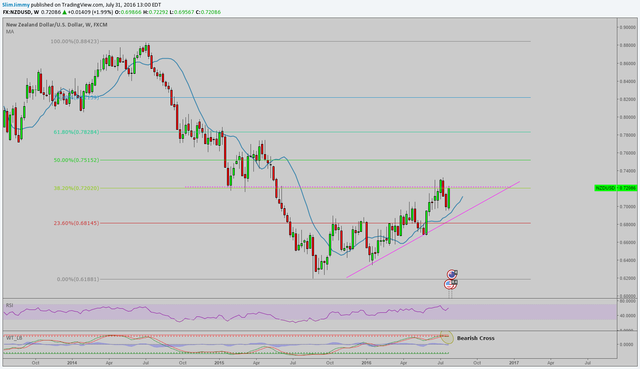
We see on the below weekly chart that the New Zealand dollar as run up against a previous support level, which coincides nicely with a long term fib level.
You’ll also note that price has respected the fib levels on the weekly chart to a fair degree, but not to what I would call a strong degree.
NZD/USD (Weekly)
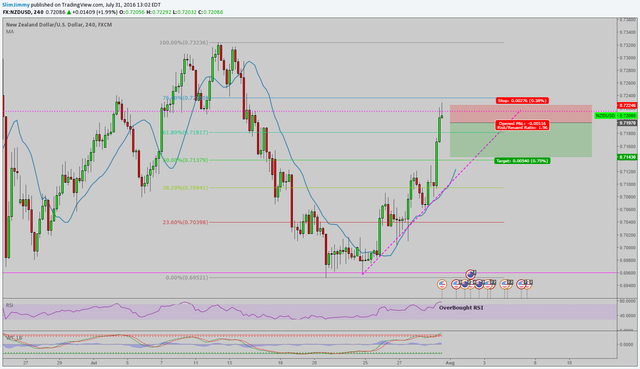
On the below 4 hour chart we also see a good indication with the overbought RSI and hammer doji, that NZD might be due for a pull back.
Depending on the US ISM report on Monday, I might look to ride a short position down to the 0.5 fib level at around 0.71379.
But this will be wait and see trade. Keep an eye on lower time frame charts as ISM report is released.
NZD/USD (4 Hour)
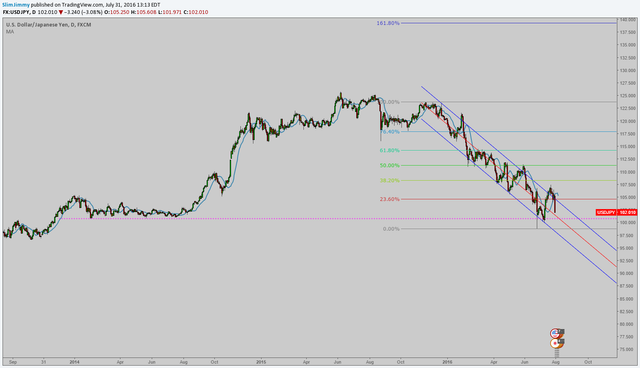
Bonus Chart: USD/JPY (Daily)
Just one to keep an eye on. I've been riding USD/JPY as it continues down its long standing regression trend, but I’ll be keeping a close eye on it around this historic support level.
Note: a good setup for a reversal on this timeframe could be a week or more out.
Thanks for reading! And would love to hear your opinions and analysis!
Cheers!
Hi! This post has a Flesch-Kincaid grade level of 7.8 and reading ease of 80%. This puts the writing level on par with Tom Clancy and F. Scott Fitzgerald.