Analysis of the SAVINGS feature
Link to the github repository
https://github.com/steemit/steem
1. INTRODUCTION
In this contribution I continue with the fourth part of the series in which I analyze the flow of tokens in the Steem ecosystem.
After analyzing the flow of REWARDS, the flow of the internal MARKET and the flow in the POWER-UP/DOWN process, now I focus on the flow of tokens to and from SAVINGS.
.gif)
Previous analyzes that deal with this feature:
- Analysis: User's Savings Deposit and Withdrawals Behavior created by @@@juecoree on april 2018 scope for three moth time period of January to March 2018.
THE SAVINGS FEATURE
Savings accounts allow you to protect your liquid STEEM and SBD in the event your account is hacked / stolen. All transfers out of savings accounts have a 72 hour (3 Days) delay during which the sender can notice, recover their account and cancel the transfer.
This feature is hugely beneficial for any and all exchanges using Steem. The vast majority of their holdings should be kept in savings accounts to minimize the potential loss from a hack.
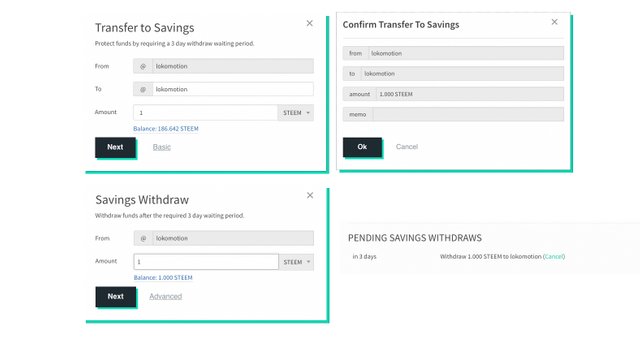
TABLES AND VIEWS
The information of the SAVINGS feature can be found in the TxTransfers table
SELECT *
FROM TxTransfers
WHERE
TxTransfers.type = 'transfer_to_savings'
ORDER BY TxTransfers.timestamp DESC

SELECT *
FROM  TxTransfers
WHERE
TxTransfers.type='transfer_from_savings'
ORDER BY TxTransfers.timestamp DESC
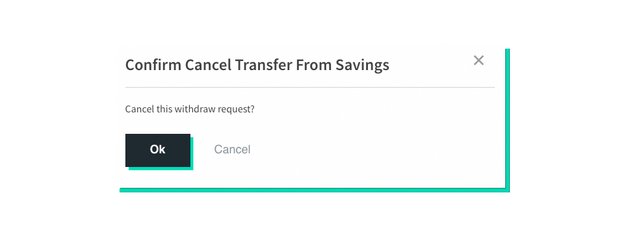
As the withdrawals can be canceled in those 3 days of delay it is possible to obtain the information of the completed withdrawals in the table VOFillTransferFromSavings
SELECT *
FROM   VOFillTransferFromSavings
ORDER BY VOFillTransferFromSavings.timestamp DESC
2. ANALYSIS
Let's see to see the monthly temporal evolution of the amount of tokens transferred to and from savings differentiating between STEEM and SBD.
STEEM SAVINGS
Monthly Evolution - STEEM to SAVINGS

Two moments stand out in 2017-03 and 2018-02 when a large amount of STEEM was transferred to SAVINGS, over 21M and 11M respectively. In the rest of the months an average of 365K was transferred. Currently, In 2018-09 the amount has been over 10k STEEM.
Unique number of Accounts - Monthly Evolution

Regarding the number of unique accounts that have used this feature, it can be said that they are a very small number, reaching the maximum value of 1496 monthly accounts in 2018-01. In the last months this amount has been reduced to values around 800 monthly accounts.
AVERAGE STEEM PER ACCOUNT to SAVINGS - Monthly Evolution

By dividing the monthly STEEM amounts and the number of monthly accounts, we obtain a ratio that gives an idea of the average amount of STEEM per account transfered to SAVINGS, obtaining a peak of 70k STEEM in 2017-03 and another one of 10k in 2018-02. In the last months it is located at an monthly average of 182k STEEM per account.
- STEEM from SAVINGS - Monthly Evolution

Regarding the negative flow or withdrawal of STEEM from SAVINGS we see that it has a very different form. Presents a sawtooth shape with a higher peak in 2017-09 (10M STEEM) with a kind of periodicity (distance between consecutive local minima) over 1.5 months.
> STEEM FLOW to/from SAVINGS - Monthly Evolution -
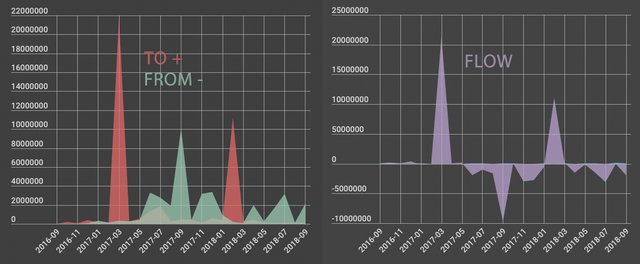
I have calculated the flow as the difference between the amounts to SAVINGS and the amounts from SAVINGS. It can be appreciated two large positive flow in the form of a triangle, and two periods of negative flow, of greater duration, in the shape of a mountain range.
> ACCUMULATED STEEM IN SAVINGS - Monthly Evolution -

Another way to see the flow it is by calculating the amount of STEEM accumulated monthly. We see a figure with two very strong climbs (reaching 22M STEEM in 2017-05) and two staggered descents with a minimum in 2018-01 of 1.2M, with a current value over 4M STEEM.
Trying to predict #1
Although the behavior of the SAVINGS feature is the effect of the situation in Steem, if we simply see them as two variables that present a certain correlation we can use the STEEM SAVINGS flow to predict Steem's behavior.
- Looking at the FLOW chart it could be said that The end of the second stage of negative flow would occur in a period of 1.5 months, where a third stage of positive flow lasting approximately one month would begin.
- Looking at the ACUM chart it could be said that The next local minimum would take between 1 and 2 months to rise again quickly in the next local maximum.
- This would point out that "something" should happen in the next two months, which would coincide in the months of November and December '18.
SBD SAVINGS
Repeating the same process for the case of SBD, we obtain:
SBD to SAVINGS -Monthly Evolution

The behavior of SBD SAVINGS is quite different. First notice that the amounts of tokens are much smaller than in the case of STEEM SAVINGS. The highest peak of 331k SBD has occurred recently in 2018-07, reaching currently a value of 87k SBD last September. Therefore, unlike STEEM, the last months have been the most active.
UNIQUE NUMBER OF ACCOUNTS USING SBD SAVINGS
(and comparation with the STEEM case)

On the other hand, the number of accounts involved has been greater than in the case of STEEM, although its monthly evolution has had a similar form, with its peak in 2018-01, with almost 3,500 accounts, reducing that amount to the present time with a value of 656 monthly accounts (which is below the number of accounts in the STEEM case with a value of 785 monthly accounts).
AVERAGE SBD to SAVINGS BY ACCOUNT

Regarding the monthly evolution of the average value of SBD transferred to SAVINGS per account, we see that after a very high value of about 3,500 SBD in the first month, it remained in small values below 100 SBD with a minimum value of 10 SBD in 2017- 12. In the last months it has increased to reach values around 200 SBD.
SBD from SAVINGS - Monthly Evolution

The withdrawal of SBD from SAVINGS also had a maximum in 2018-07 (389k SBD) that coincided with a maximum in the transfer of SBD to SAVINGS that shows, again that the period between 2018-06 and 2018-08 has been the most active in both ways. Currently the monthly withdrawal of SBD from SAVINGS has a value of - 52k SBD
> SBD FLOW to/from SAVINGS - Monthly Evolution -

The flow of SBD SAVINGS also presents a certain average periodicity of 1.5 months (distance between consecutive zeros). It is currently in positive flow (increasing the SBD in SAVINGS).
> ACCUMULATED SBD IN SAVINGS - Monthly Evolution -

Observing the amount of SBD accumulated in SAVINGS shows that the maximum peak is currently occurring with a value of 296k SBD after a very strong rise during 2018-08.
Trying to predict #2
- The flow of SBD to SAVINGS also shows an approximate periodicity of 1.5 months.
- The ACUM chart shows that we are in a situation of maximum that tends to decelerate and to be in a local minimum in 1 or 2 months.
- Although less clear than in the case of STEEM, it seems to indicate a change in trend in the next 2 months.
ANALYSIS OF THE MOST ACTIVE ACCOUNTS
The total number of unique accounts using the SAVINGS feature has been 12,380 (STEEM) and 19,457 (SBD). These amounts of accounts are really very small but as we have seen previously they have handled large amounts of tokens, especially in STEEM.
Which accounts have been the most active?
IN NUMBER OF TRANSFERS TO SAVINGS
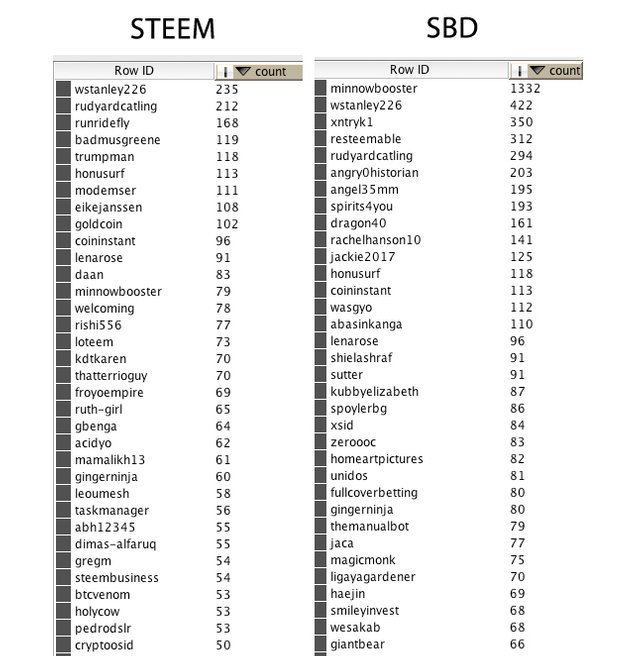
Stats considered all accounts
NUMBER OF TRANSFERS TO SAVINGS
Although some accounts have used SAVINGS tens or hundreds of times, the average account has used it around 2.5 times. The exact values for each type of tokens result:
- STEEM - Mean 2.36 ; Std-dev 5.99
- SBD - Mean 2.79 ; Std-dev 12.32
Which accounts have been the most active?
IN NUMBER OF TOKENS
These are the accounts that more tokens have transferred (cumulative total sum) to SAVINGS throughout the entire period since this feature was implemented. In this list we see accounts with huge amounts of tokens that make use of this feature to add an additional layer of security on the balances.
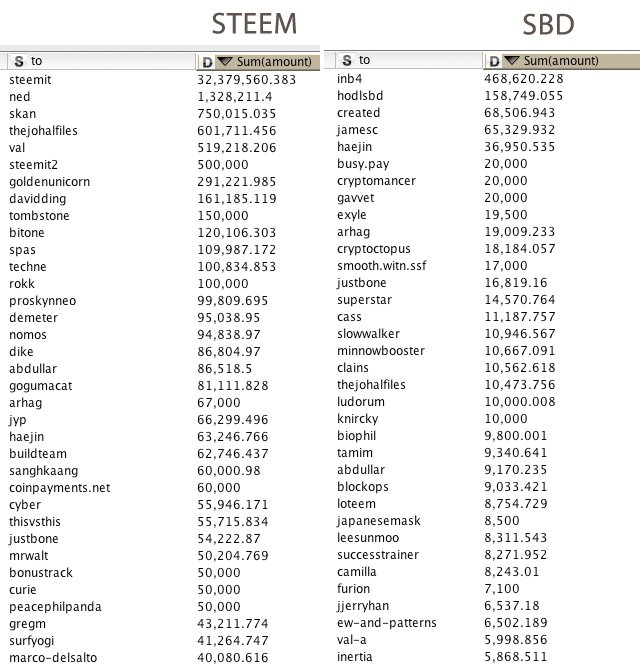
And finally...
Currently, what are the accounts with more tokens in their SAVINGS?
Making the following query for the Accounts table
SELECT
Accounts.name,
Accounts.savings_balance,
Accounts.sbd_balance,
FROM  Accounts
WHERE
Accounts.savings_balance <> '0.000 STEEM' OR
Accounts.savings_sbd_balance <> '0.000 SBD'
Grouping by name and adding their tokens (differentiating between STEEM and SBD) we obtain:
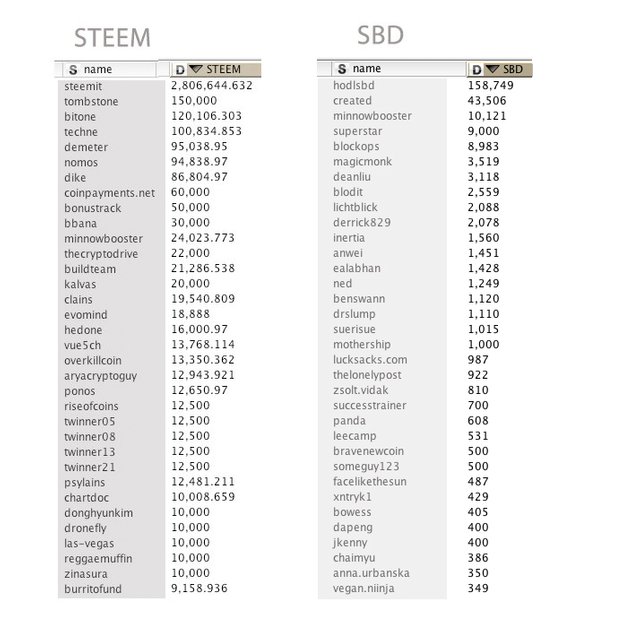
Are the big accounts using the SAVINGS feature?
I have obtained the accounts with the highest balances (STEEM and SBD) and indicating their savings balances.
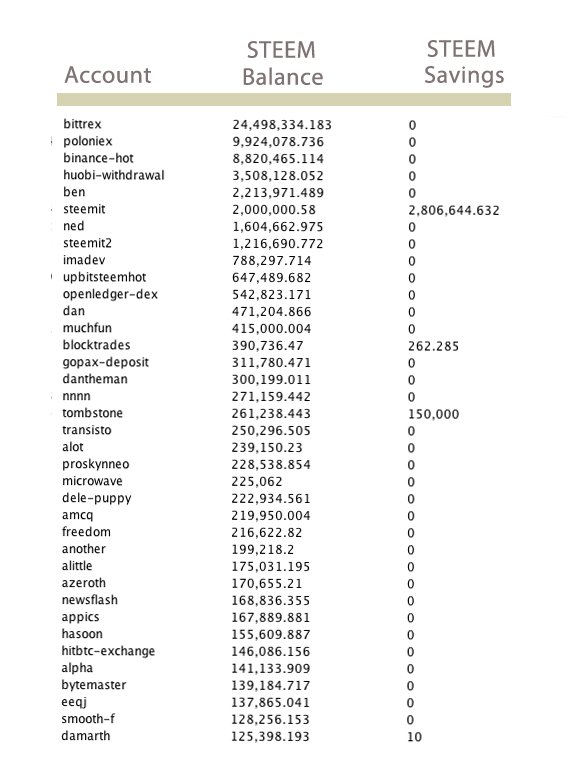
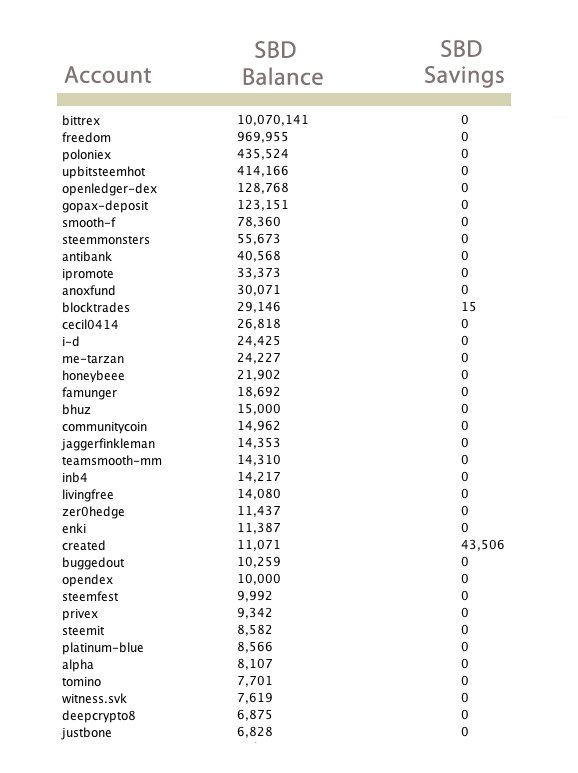
As we can see, in general this feature is not being used for the big accounts and only the exchange blocktrades is making use of SAVINGS in STEEM.
CONCLUSIONS
Regarding the use of the SAVINGS feature in view of what is presented in this analysis, it can be said that:
The SAVINGS feature has been used only by a relatively small number of accounts (<20k).
In number of total tokens, the amount of STEEM (41.3M) transferred to SAVINGS has been much greater than the amount of SBD (1.6M).
Currently, the flow of STEEM SAVINGS is negative (reducing STEEM) and the flow of SBD SAVINGS is positive (increasing SBD).
The flows of tokens to/from SAVINGS presents a periodicity of change of trend between 1 and 2 months. Waiting for a next change in November - December '18.
In the last few months SAVINGS has been more active in SBD than in STEEM.
Currently there are 4M STEEM and 300k SBD accumulated in SAVINGS.
In general, it is not being used by the large numbers and exchanges (except blocktrades in STEEM).
3. SOURCES, DATES & TOOLS
DATA SOURCE
I have used SteemSQL, a publicly available Microsoft SQL database containing all the Steem blockchain data held and managed by @arcange.
ANALYSIS SOURCES
- Analysis: User's Savings Deposit and Withdrawals Behavior created by @@@juecoree on april 2018 scope for three moth time period of January to March 2018.
DATES
- Scope of the analysis 2016-09-1 to 2018-09-30
- Submitting date 2018-10-22
Hi @lokomotion, again a high quality analysis!
I must admit, I never used the savings feature myself and I'm not sure I'd trust steemit with an account recovery within 3 days. But this may be different for high-stake accounts. The savings feature can provide additional security for exchanges, but it also reduces their ability to instantly react on larger withdrawal requests. Your analysis shows that they apparently seem to weight the liquidity aspect higher.
I like the predictions and I'm looking forward to the "something" about to happen in 1-2 months :)
Your contribution has been evaluated according to Utopian policies and guidelines, as well as a predefined set of questions pertaining to the category.
To view those questions and the relevant answers related to your post, click here.
Need help? Write a ticket on https://support.utopian.io/.
Chat with us on Discord.
[utopian-moderator]
@crokkon, thanks a lot for that final conclusion. In these moments of krypto-purge the important thing is not to disappear. In Steem we are fortunate to be able to contribute instead of just waiting as in other krypto- tribes.
Thank you for your review, @crokkon!
So far this week you've reviewed 3 contributions. Keep up the good work!
Hi @lokomotion!
Your post was upvoted by @steem-ua, new Steem dApp, using UserAuthority for algorithmic post curation!
Your post is eligible for our upvote, thanks to our collaboration with @utopian-io!
Feel free to join our @steem-ua Discord server
Hey, @lokomotion!
Thanks for contributing on Utopian.
We’re already looking forward to your next contribution!
Get higher incentives and support Utopian.io!
Simply set @utopian.pay as a 5% (or higher) payout beneficiary on your contribution post (via SteemPlus or Steeditor).
Want to chat? Join us on Discord https://discord.gg/h52nFrV.
Vote for Utopian Witness!
Congratulations @lokomotion! You received a personal award!
Click here to view your Board
Do not miss the last post from @steemitboard:
Congratulations @lokomotion! You received a personal award!
You can view your badges on your Steem Board and compare to others on the Steem Ranking
Vote for @Steemitboard as a witness to get one more award and increased upvotes!