Analysis of the Steem Power Up/Down Flow
Link to the github repository
https://github.com/steemit/steem
1. INTRODUCTION
In this contribution, I continue with the third part of the series in which I analyze the flow of tokens in the Steem ecosystem.
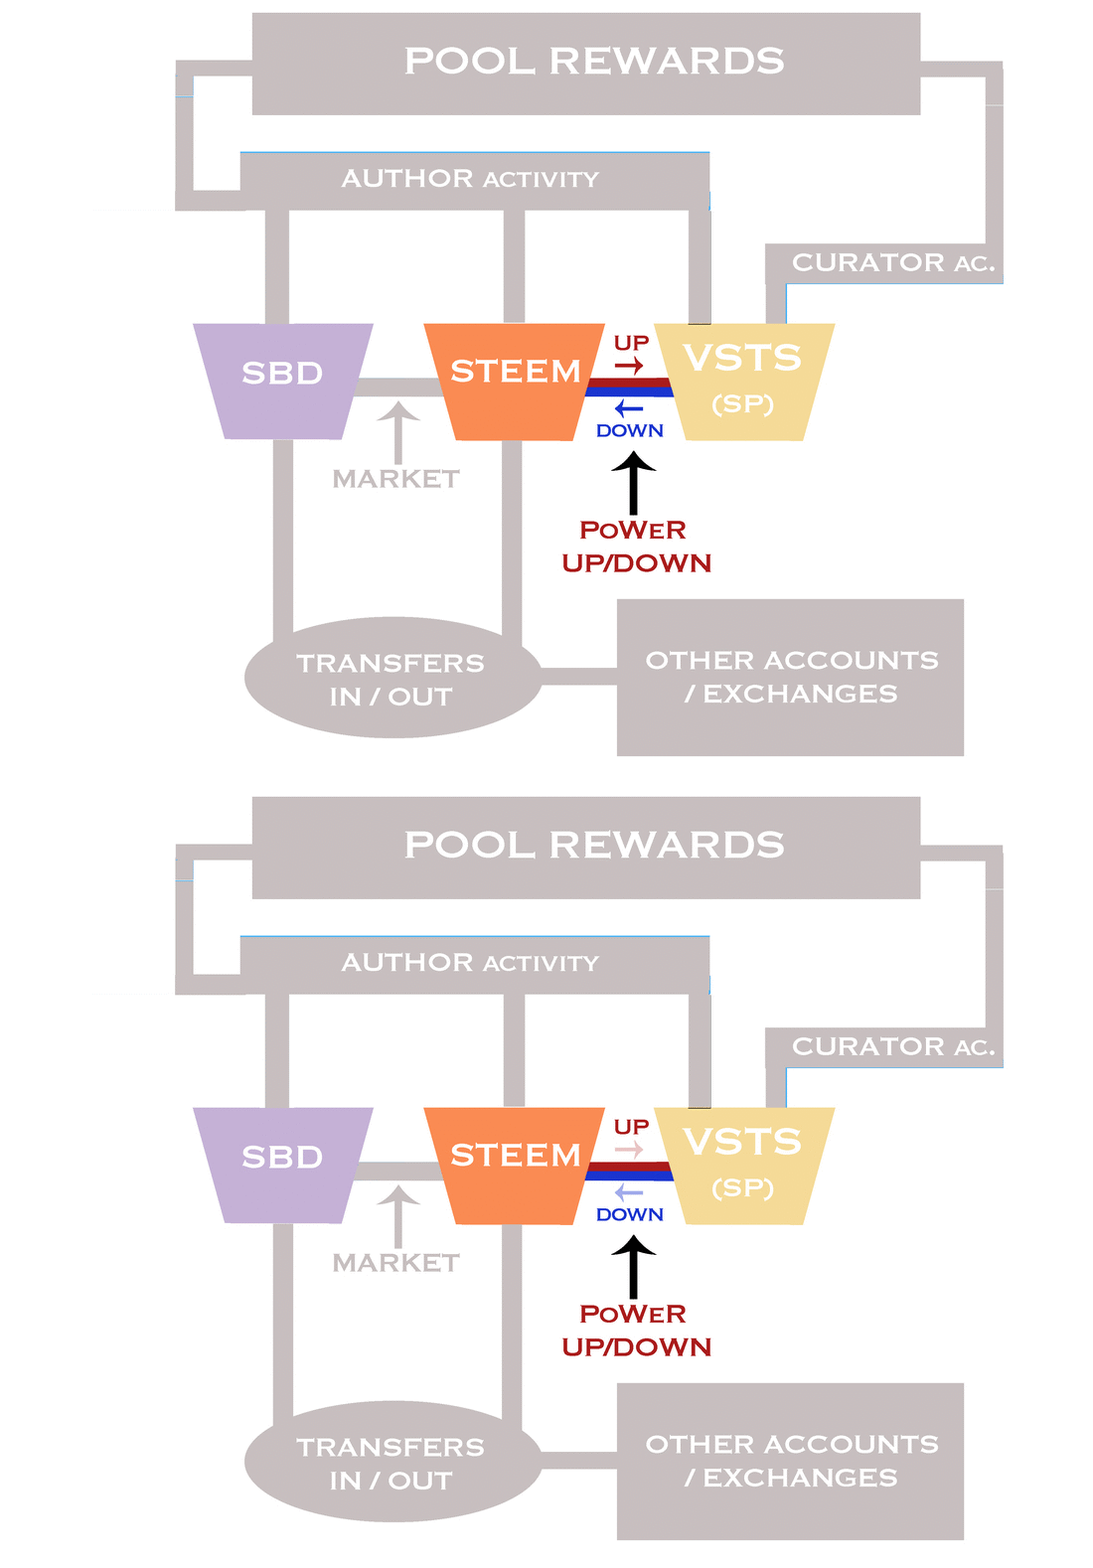
After analyzing the flow of Rewards (SBD, STEEM and VESTS) and the internal MARKET, I focus on the flow, in both directions, between STEEM and VESTS that is usually called as POWER-UP (STEEM to VESTS) and POWER-DOWN (VESTS to STEEM).
Some basics about VESTS, STEEM and STEEM POWER
Steem power is essentially STEEM converted to VESTs. Your VESTED STEEM can be converted back into STEEM within a 3 Month Period. STEEM is the cryptocurrency, while STEEM POWER is STEEM that's been set aside for the purposes of the community.
Powering-up STEEM moves it to be used for the community, and powering-down STEEM POWER moves it out of the community to just cryptocurrency form. In order for you sell VESTED STEEM for STEEM, Steem Power has to be converted to STEEM which decreases the number of VESTS.
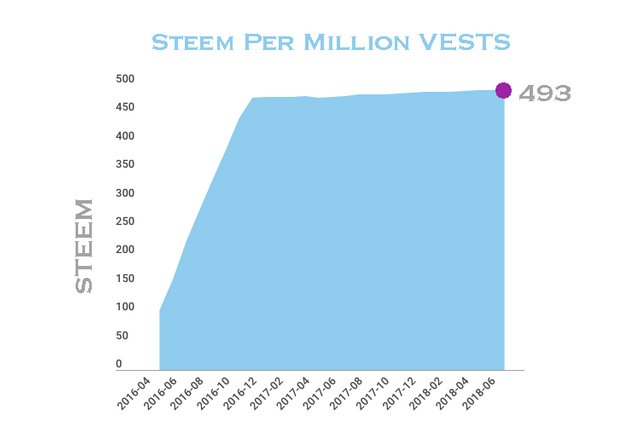
If you notice that you seem to get more Steem power over time, it's because the conversion rate changes over time which is why an account balance appears to be growing. It's showing you how much STEEM your VESTs are worth. The change in number that you see is a reflection of the change in the conversion rate between VESTs and STEEM. In order to sell, Steem Power it has to be converted to STEEM which decreases the number of VESTS.
Steem Per Million VESTS
Currently: 1 M VESTS = 493.46 STEEM
2. ANALYSIS
2.1. POWER-UP ANALYSIS
TABLE: TxTransfers
MAIN QUERY:
SELECT  *
FROM TxTransfers
WHERE  TxTransfers.type='transfer_to_vesting'
SOME RECORDS

MAIN USED FIELDS
ID, from, to, amount, amount_symbol, timestamp
Some processed data results:
- A total of 840,487 power-ups have been made
- There are 610,275 records where from = to
- There are 230,212 records where from <> to
NOTE: THE CASE OF to=""
I have detected 5,170 records (done by 848 accounts) throughout the period (March 2016-July 2018) where the field to was empty which does not make sense. I do not know why this happens, maybe it's just an error (or anomalous case) when passing the information from the blockchain to the SteemSQL database but examining the accounts I considered that they should actually be considered as to=from . In any case, it is a very small number that substantially influences the results.
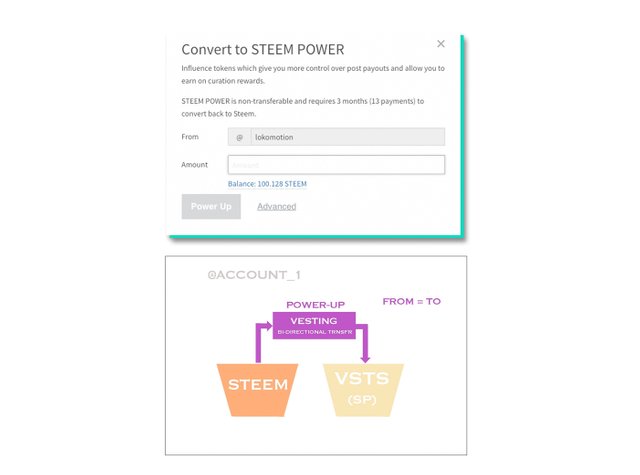
INTRA-ACCOUNT POWER-UP
from = to means that an account uses its STEEM to convert them for the equivalent value in VESTS that will be entered in their balance of VESTS (or STEEM POWER).
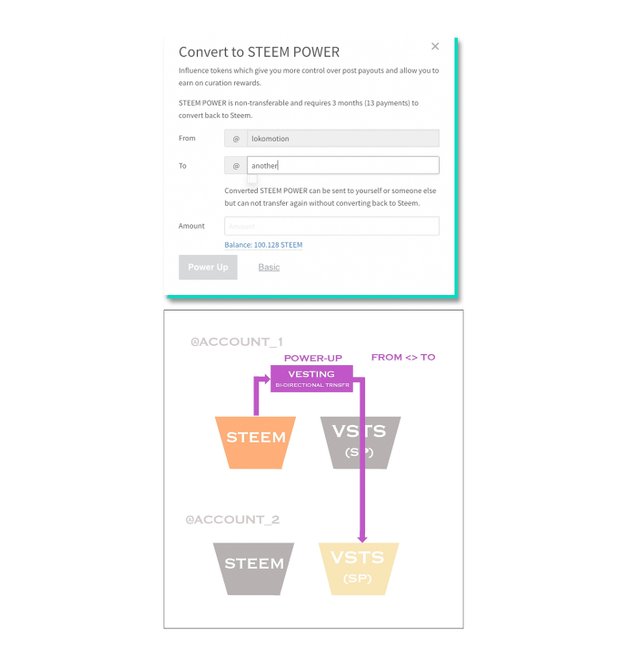
INTER-ACCOUNTS POWER-UP
from <> to means that an account uses its STEEM to convert them for the equivalent value in VESTS but will be stored into the balance of VESTS (or STEEM POWER) of another account.
NOTE:
We can consider as an exception to this rule when using the possibility of buying VETST (SP) directly with BLOCKTRADES using another cryptocurrency such as Bitcoin (BTC), Ethereum (ETH), etc.
In this case, although from <> to, I will consider it as a power-up (although it may not be a conversion from STEEM) of the INTRA-ACCOUNT type since it is expected that the owner of the account will be the one who makes the purchase of VESTS (SP) using blocktrades.

Then, finally in my analysis I will consider:
INTRA-ACCOUNT POWER-UPs
(from = to) OR ( to = "") OR (from = "blocktrades" AND to <> "blocktrades")INTER-ACCOUNTS POWER-UPs
(from <> to AND to <>"" AND from <> "blocktrades")
OVERVIEW OF THE POWER-UPS
COUNT (ID)
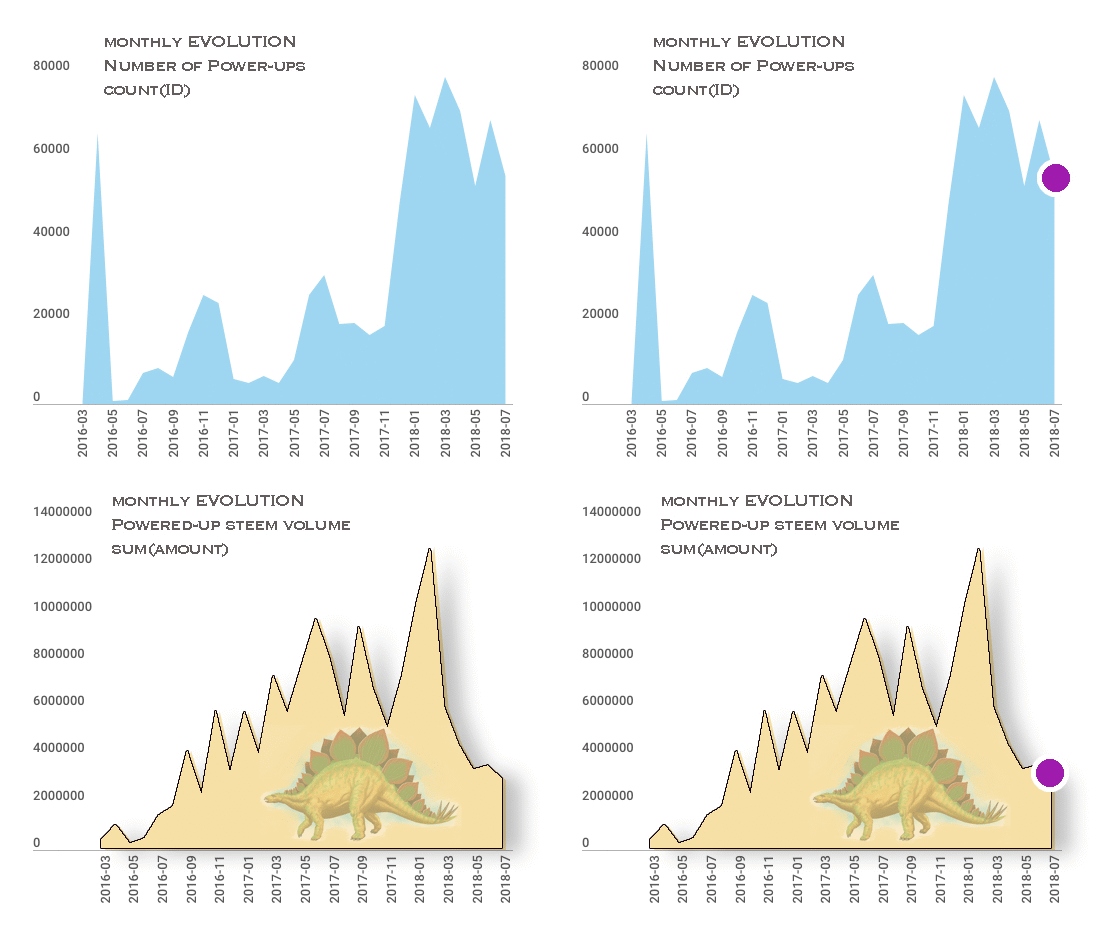
We observe that since December 2017 it has been in the highest values between 60k and 80k per month except for the month of May 2018, where it goes down to approximately 56k to rise again to values higher than 60K in June 2018.
SUM (Amount)
This strange figure resemble the crests of a Stegosaurus. However, in recent months it seems that this pattern has been interrupted.
That is, in recent months the magnitude of the power-up is at levels similar to September to November 2016. Soon we will see if the Stegosaurus will have another bone plate or not.
MEAN & STD-DEV
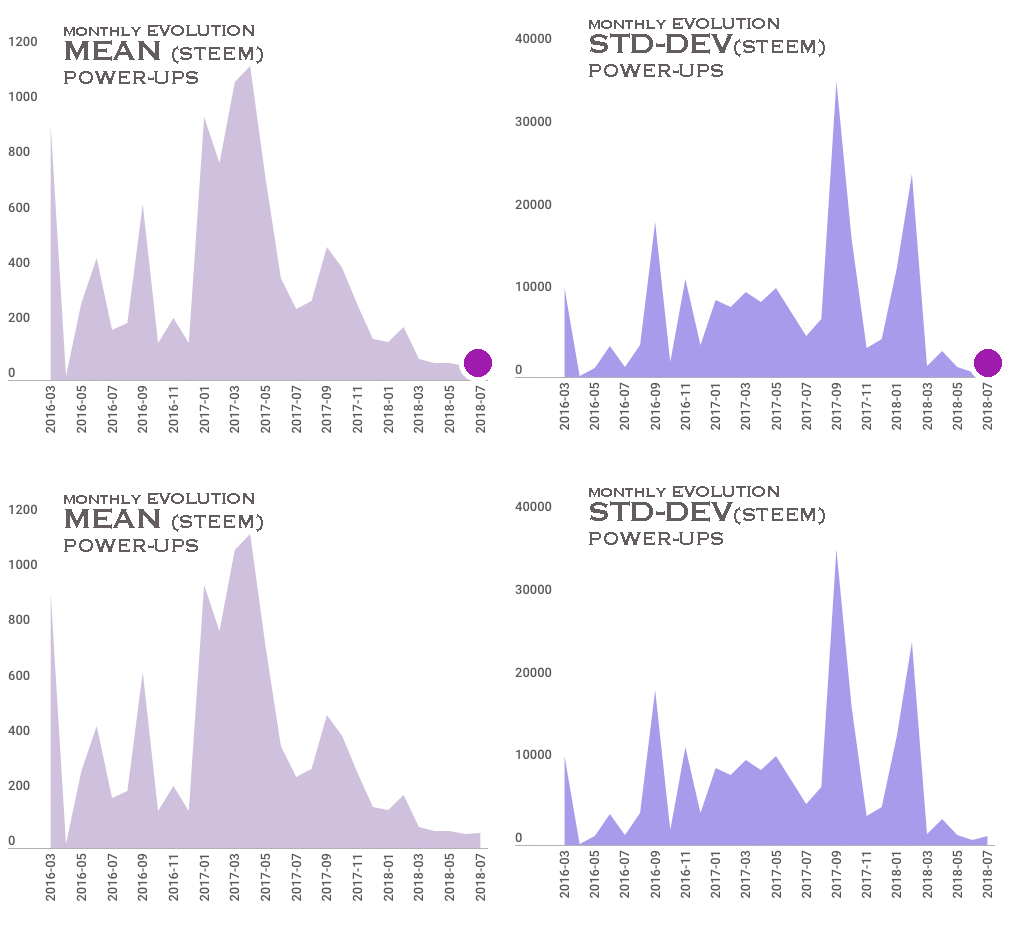
Now I analyze the STEEM amounts used to perform the POWER-UPs throughout the historical period and calculate the mean and the standard deviation.
MEAN (Amount)
Since the high values reached in the first months of 2017 it has been reducing, with some significant increases in October 2017 and February 2018, until reaching the current values which are the lowest of the period standing at average values of 50-60 STEEM.
STD-DEV (Amount)
The standard deviation, that gives an idea of the diversity in the amounts of STEEM powered-up, two large peaks stand out in September 2017 and February 2018 and in the last months until today, as the mean values, is located at its minimum values around 600-1000 STEEM
UNIQUE ACCOUNTS
Unique count (FROM)
Unique count (TO)
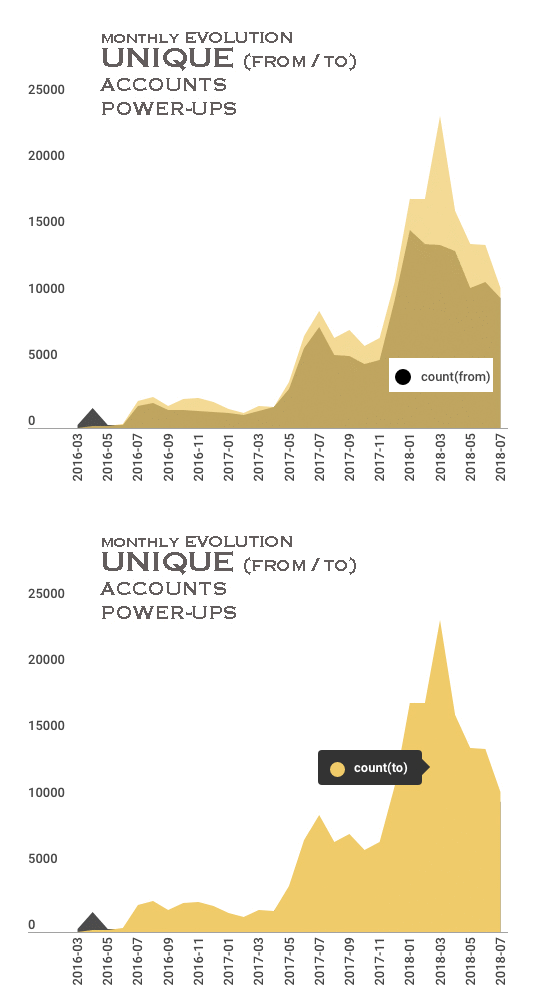
Regarding the evolution of the number of accounts involved in the power-ups, we observe three growing steps that tend to stabilize for a few months, although after the last one, happened in February 2018, show a continuous decline from the 23,570 accounts (TO) until approximately 11k in July 2018.
The number of FROM and TO accounts coincide at times of great growth (INTRA-COUNT POWER-UPs predominate) and TO accounts outnumber the FROM accounts (the INTERACCOUNTS POWER-UP predominate) in periods of stability and decrease.
Some Conclusions
Analyzing all together we can say that: although the number of power-ups is high, the number of accounts involved is decreasing. The average and the diversity of the amounts of STEEM converted into Steem Power are now at minimum values and consequently the total amount of STEEM powered-up is tending to stabilize in some way breaking the Stegosaurus pattern that has followed for about two years.
More detailed analysis
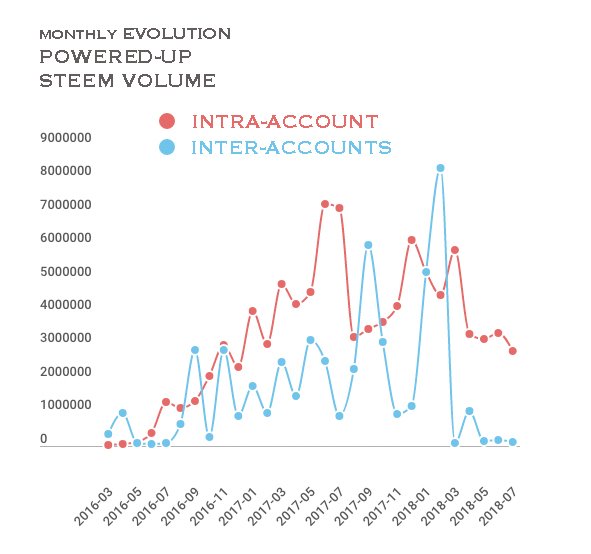
SUM (amount) differentiating between INTRA_ACCOUNTS and INTER_ACCOUNTS power-ups
INTRA_ACCOUNT POWER -UP in RED
It has been the main component, except in some occasions like 2017-09 and 2018-02.
Currently it has been placed in 3000k (3M) 96.44% compared to 150K 3.56% of the inter-accounts component.INTER_ACCOUNTS POWER -UP in BLUE
It is normally in contra-phase (90 degrees) with the other component and It is currently in low values.
More conclusions
- If we think that the inter-accounts power up are related to some strategies that use a variety of accounts to use the voting power of those accounts, we can say that this behavior that has predominated just after moments of euphoria in the ecosystem is now stabilized at low values.
- The Intra-account power-ups, which we can consider as more natural, are now in relative levels of medium magnitude with a tendency to decrease.
More detailed analysis
In this case, for the intra-account power-ups, I distinguish between those made using the STEEM balance or by directly buying the VESTS using blocktrades using any available cryptocurrency.
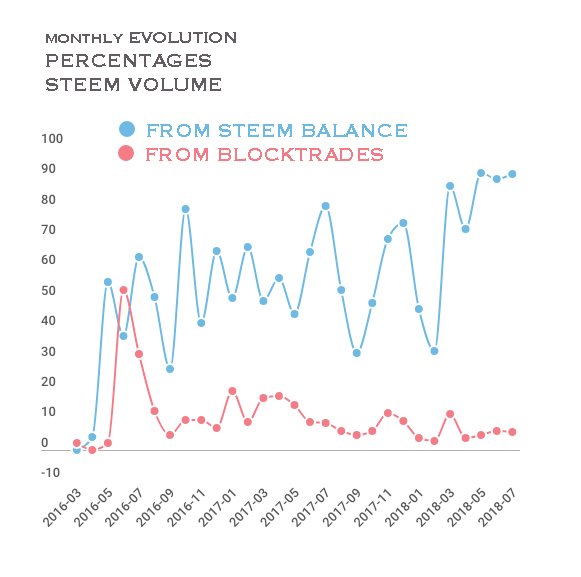
Most of the power-ups have been made by converting STEEM into VESTS.
The percentage of power-ups made buying directly from Blocktrades reached a maximum of approximately 50% in 2016-06 and then fluctuated between 12% and 3%, reaching the current value of 5.80%.
In the last months, the proportions of these two ways to increase the number of VESTS seem stabilized.
2.3. POWER-DOWN ANALYSIS
USED TABLE: VOFillVestingWithdraws
This virtual operation occurs after you started a PowerDown. Each week, the system will convert a portion of your VESTS into STEEM and here is where this conversion is recorded.
MAIN QUERY
SELECT  timestamp, from_account, to_account, withdrawn, deposited
FROM VOFillVestingWithdraws
SOME RECORDS ARE

Observing the records seems to indicate that when a power-down is performed, the deposited STEEM goes back to the account that made a previous power-up so it can also be talked about INTRA-ACCOUNT and INTER-ACCOUNTS POWER-DOWNs
INTRA-ACCOUNT POWER-DOWN

INTER-ACCOUNTS POWER-DOWN
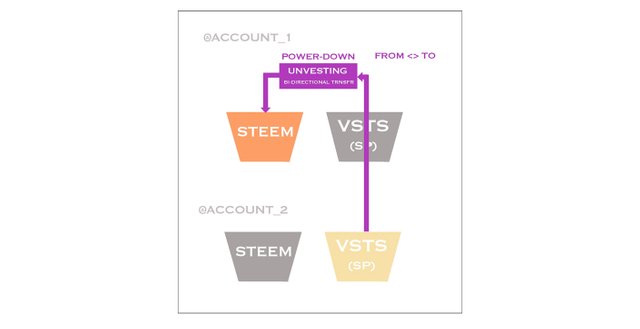
OVERVIEW OF THE POWER-DOWNS
COUNT(ID)
The evolution of the number of withdrawals shows two large peaks, the first centered in 2017-07 and the second in May 2018 that reached an approximate value of 85k, very similar to the current value.
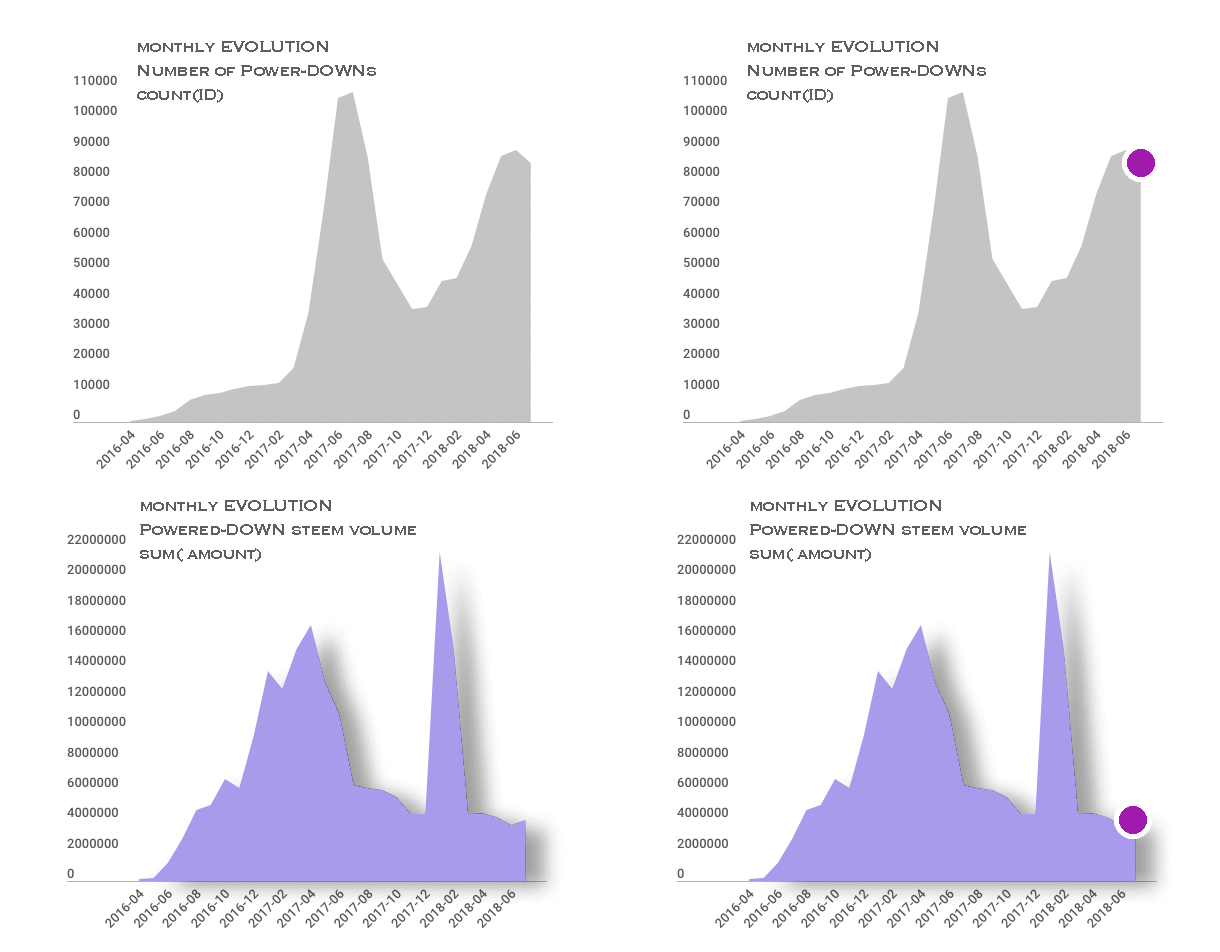
SUM (deposited)
- Considering the total sum of the STEEM deposited in the power-downs we also observe two large peaks but slightly ahead of those shown above and with considerably different temporary widths.
- The current level is seems stable and relatively low near 4M STEEM.
MEAN & STD-DEV
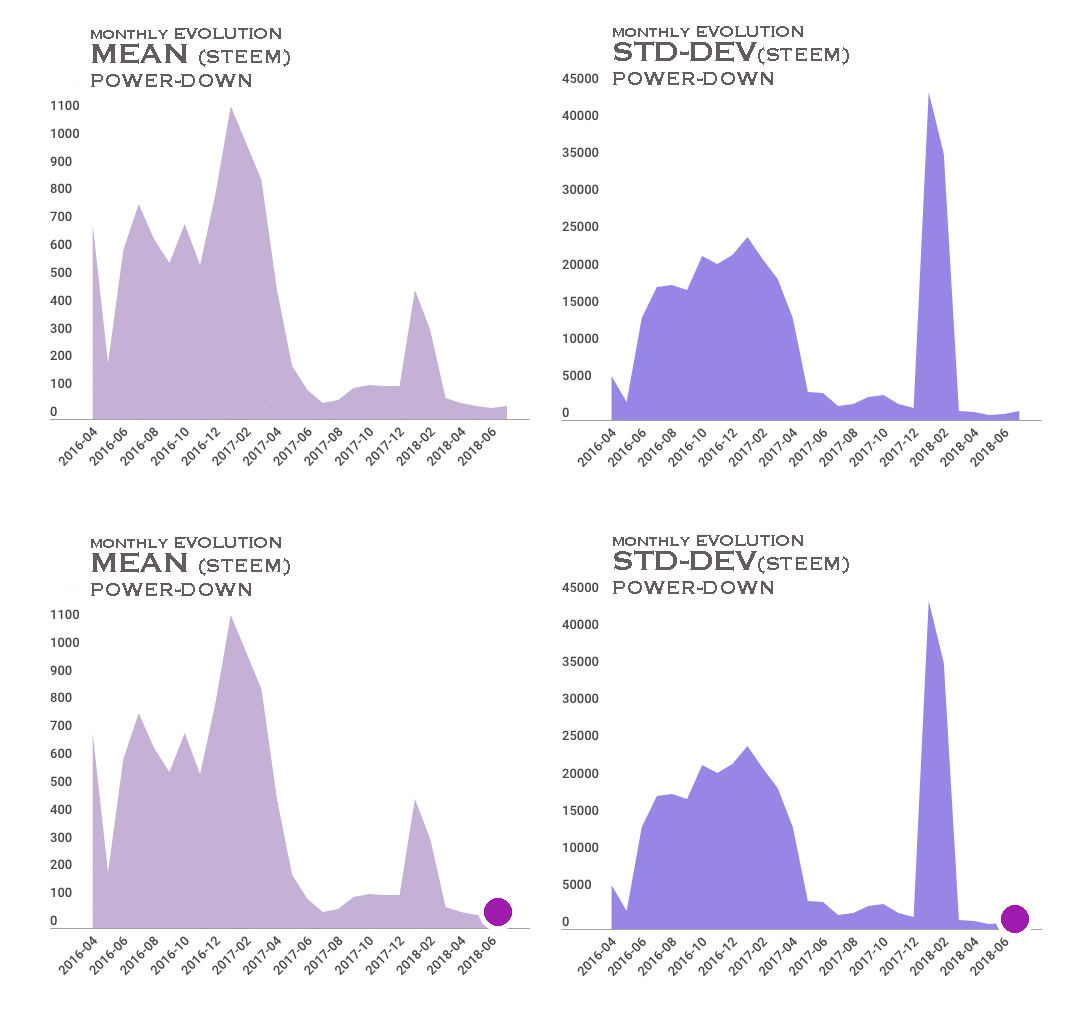
MEAN( deposited)
Two well differentiated zones are observed. The first from the beginning until 2017-04 where the average value of withdrawals remained high. The second one that arrives until the present time where the average deposited amounts are below of 100 STEEM, with the exception of the peak of average magnitude between January and March of 2018.
STD-DEV (deposited)
This graph reveals a behavior similar to the MEAN where those two well differentiated stages are accentuated. The current value is at minimum levels that reflect the lower diversity of VESTS withdrawals.
ACCOUNTS
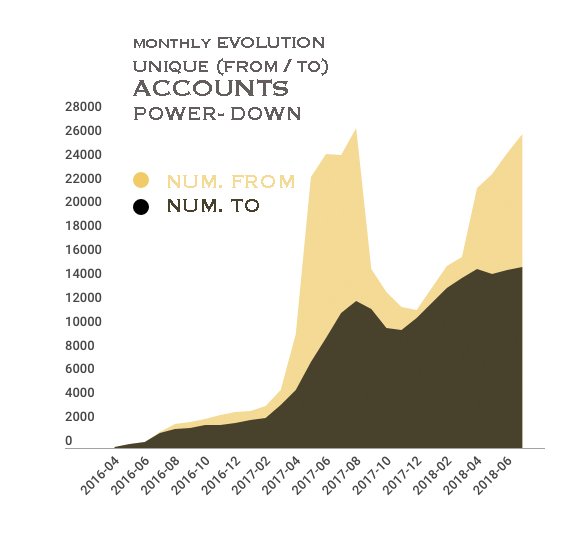
FROM indicates the number of accounts from which the VESTS withdrawals and TO the number of accounts in which the equivalent STEEM were deposited.
When the values of these two components are differents (being FROM always greater than TO), it is because the disinvestment of many accounts towards a single destination account is occurring, This occurred between 2017-04 and 2017-08 and occurs increasingly from 2018-03 to the present.
In periods of growth and euphoria, such as for example, between 2017-12 and 2018-02, the number of FROM accounts approaches the number of TO accounts .
Some Conclusions
Bearing in mind that a power-down is technically a divestment of VESTS and its settlement or liquidation in STEEM, we might think that this is negative for the ecosystem or community.
However, because we analyze the entire historical period, we must consider that the power-downs performed by *large accounts were necessary (and positive) to be used by the system to make it grow.
This type of behavior is detected when:
- The number of monthly withdrawals is low,
- The total deposited STEEM deposited is high and
- The mean values of deposited STEEM are also high.
When the opposite happens, (the number of withdrawals are high but the sum, the average and the STD-dev are relatively low) would indicate power-downs performed by many "small" accounts and for small amounts of deposited STEEM. This behavior could be considered as a process of disinvestment or exit from the system making liquid the VESTS into STEEM as it happened between 2017-04 and 2017-09 and it is happening now since March 2018.
In general, the two processes described manifest together and overlap.
More detailed analysis
SUM (deposited) differentiating between INTRA_ACCOUNTS and INTER_ACCOUNTS POWER-DOWNS
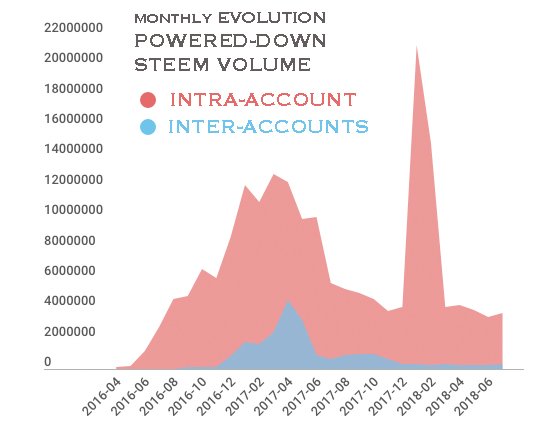
In this graph we can see the effect of the inter-accounts power-downs can be considered small or low compared to the intra-accounts power-downs and especially in the last months where it has reached minimum values.
Some TOP accounts.
There are 46,322 accounts that have performed intra-account (FROM=TO) power-downs
Sorted by DESC SUM (withdrawn)
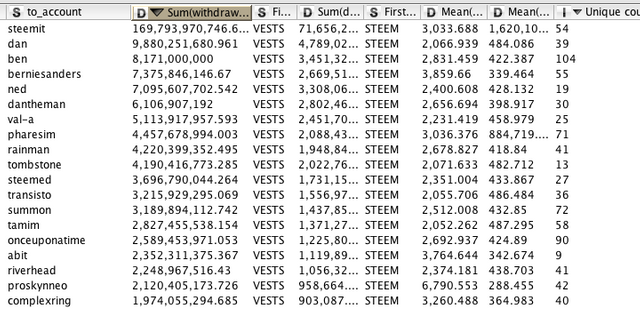
As I indicated above, the accounts that have withdrawn millions of VESTS in a relatively low number of withdrawals belong mainly to the system's management accounts and their creators, so their withdrawals are destined for the growth of the system.
There are only 252 accounts that have received inter-accounts (FROM<>TO) power-downs
Sorted by DESC count (ID)
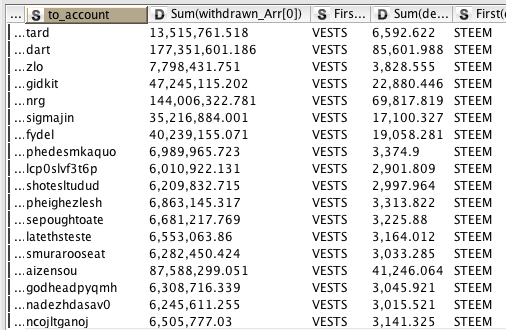
When examining the accounts with higher number of withdrawals in the inter-accounts power-downs process, the accounts @tard, @dart, @zlo stand out, along with others, that seem to be related to some rewards extraction practices. For more information you can read " A steemit analysis of @tard | comment by @naturicia " that analyzes that situation with more detail.
2.4. ANALYSIS OF THE STEEM POWER FLOW
Finally I have calculated what can be called VESTS flow (valued in STEEM) or Steem Power Flow in the POWER UP-and-DOWN processes.
Considering the POWER-UP in its positive values and the POWER-DOWN inverting its sign so that they are negative [or simply SUM (Amount in Power-Ups) - SUM (deposited in power-downs)] produces the STEEM POWER FLOW show as a green area or curve.
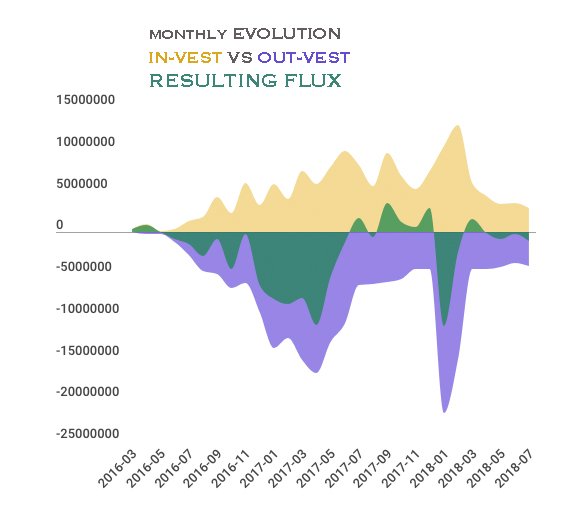
In most months, the Steem Power Flow has been negative, that is, the volume of the STEEM in the POWER-DOWNS has been greater than in the POWER-UPS, except in three periods (when the green area is above zero).
In a way, it is like facing the desire to solidify in VESTS against the desire to liquefy in STEEM. Since approximately February 2018 they have been balanced in similar values.
The total accumulated values are: POWER -DOWN (209,559,437 STEEM) and POWER-UP (146,897,312 STEEM) which implies a ratio of 1,427.
Final conclusions
I believe that in the last two years we have witnessed the Transient State after the initial impulse and some fine-tuning of the ecosystem and now we are witnessing the stabilization in a kind of Steady State of the ecosystem.
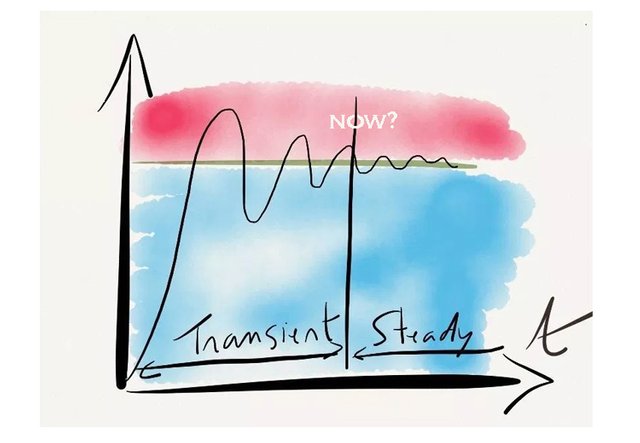
Therefore, I think we are in a moment of expectation where the power up-downs process manifests in magnitudes that we can consider organic where mainly a high number of small accounts are performing power up-downs but for relatively small amounts.
Networks of accounts that are suspicious of using reward generation strategies seem to be converting their VESTS although their final total effect is small. The fact that Power-Down process delay withdrawals for 13 weeks (3 months) shows its effectiveness. It acts like a gyroscope or an inertial mass that prevents sudden stops and excessive volatility.
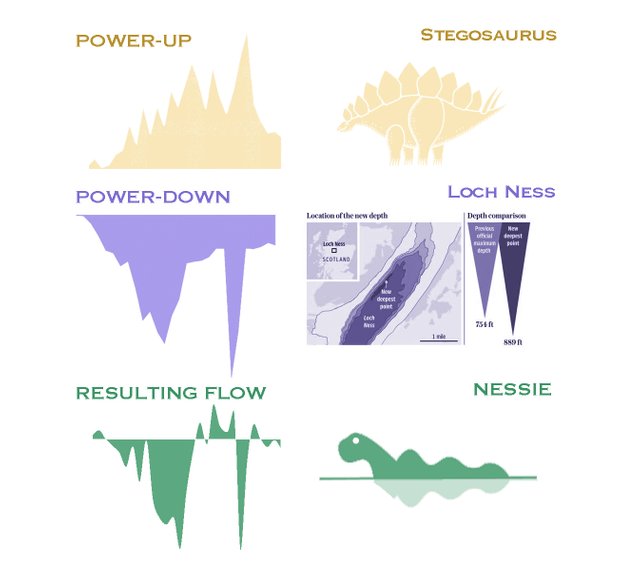
For those who like visual mnemonics.
I wanted to summarize in a kind of mnemonic-graphs using some naive concepts based on the similarity of
- The POWER-UP SUM(amount) chart with a Stegosaurus,
- The POWER-DOWN SUM (deposited) chart with the depth profile of Loch Ness in Scotland,
- The resulting Steem Power Flow as Nessie, the mythical monster of Loch Ness.
3. SOURCES, DATES & TOOLS
DATA SOURCE
I have used SteemSQL, a publicly available Microsoft SQL database containing all the Steem blockchain data held and managed by @arcange.
ANALYSIS SOURCES
- Steemit Power Down Data Analysis: done 7 months ago
- Analysis of @steemit Account Powerdown done 6 months ago
- Steemit Transfer Activity Analysis done 5 months ago
- A steemit analysis of @tard done 5 months ago
DATES
- Scope of the analysis 2016-03-30 to 2018-07-29
- Submitting date 2018-07-10
TOOLS
Hi @lokomotion, great analysis again! You've covered it (almost) all. A few minor remarks:
The
to=""case: this is actually a feature. If the destination is not set, the sending account is used, as you correctly assumed.For the power-up analysis, it could be interesting to have a look on the Steem price. A power-up with Steem at $0.5 is a different commitment than powering up the same amount of SP at Steem at $5, especially if the corresponding Steem is bought beforehand.
The power-down duration was not always 3 month / 13 weeks. I think it was considerably longer in a previous hard fork, but I can't find the details at the moment.
For the from<>to power-down analysis, you've come across a couple of account networks that managed to game the Steemit account signup, partly getting 100s of accounts with 10-30 (vested) SP.
Your contribution has been evaluated according to Utopian policies and guidelines, as well as a predefined set of questions pertaining to the category.
To view those questions and the relevant answers related to your post, click here.
Need help? Write a ticket on https://support.utopian.io/.
Chat with us on Discord.
[utopian-moderator]
@crokkon, thanks a lot for yours remarks. For me, the most difficult thing when performing an analysis is when to stop adding variables and correlations!
In the analysis I was interested mainly in the bidirectional flow between STEEM and VESTS considering that the STEEM was already owned, except for the mention I made regarding the purchase of STEEM from blocktrades.
Below I include the monthly evolution of the power-up volume superimposed with the STEEM prices in USD, BTC and ETH as well as the power-up volume valued in those currencies.
Cause or Consequence
(1) Is the price the reason why the demand of STEEM increases or decreases (to convert it into VESTS) or (2) is the price the consequence of the greater or lesser demand of STEEM in a certain currency?
I think that in general terms, there is a combined affect of the two ways of seeing it but mainly I like to interpret the price as the consequence of the demand and for that reason although the price in USD was high during the first months of 2018, the volume of powered-up STEEM was also high.
For cryptocurrencies such as BTC and ETH, prices stabilized since September 2016 which would indicate that demand for STEEM using these crypto currencies remained stable (and low) and therefore the main source of demand for STEEM to convert it into VESTS came from fiat currencies (USD / EUR) in recent times, contrary to what happened at the beginning of STEEM.
wow, great addition, thanks a lot!
Thank you for your review, @crokkon!
So far this week you've reviewed 2 contributions. Keep up the good work!
Congratulations @lokomotion! You have completed the following achievement on Steemit and have been rewarded with new badge(s) :
Click on the badge to view your Board of Honor.
If you no longer want to receive notifications, reply to this comment with the word
STOPTo support your work, I also upvoted your post!
Hey @lokomotion
Thanks for contributing on Utopian.
We’re already looking forward to your next contribution!
Want to chat? Join us on Discord https://discord.gg/h52nFrV.
Vote for Utopian Witness!