Analysis of some aspects of the tagging process in Steem/Steemit

Link to the github repository
https://github.com/steemit/steem
In this analysis I immerse myself in the world of TAGS. I want to find out how it is, statistically speaking, the behavior in the tagging process of the posts in steem/steemit.
When I met Steemit I was surprised by the set of categories shown on the left side menu of the Steemit frontend. I was wondering why these particular categories were shown and why they were arranged in that order.
When I created my first post I understood that these categories were related to the TAGS of the posts. It was also curious to know that the number of tags in a post had a minimum of 1 and a maximum of 5.
And what is supposed to be a tag?
It is assumed that the idea is to classify the posts by its main subjets to facilitate the access to these posts for the creator and for visitors.
- Is this what is being done in steem/steemit with the tags?,
- Are there different behaviors in the use of the tags?,
- What keywords are being used to classify the posts?,
- Which are the most used?,
- How has this process changed over time?
Let's start to analize
For this I have obtained a set of 80k posts created during a week from 10th to 16th, April 2018
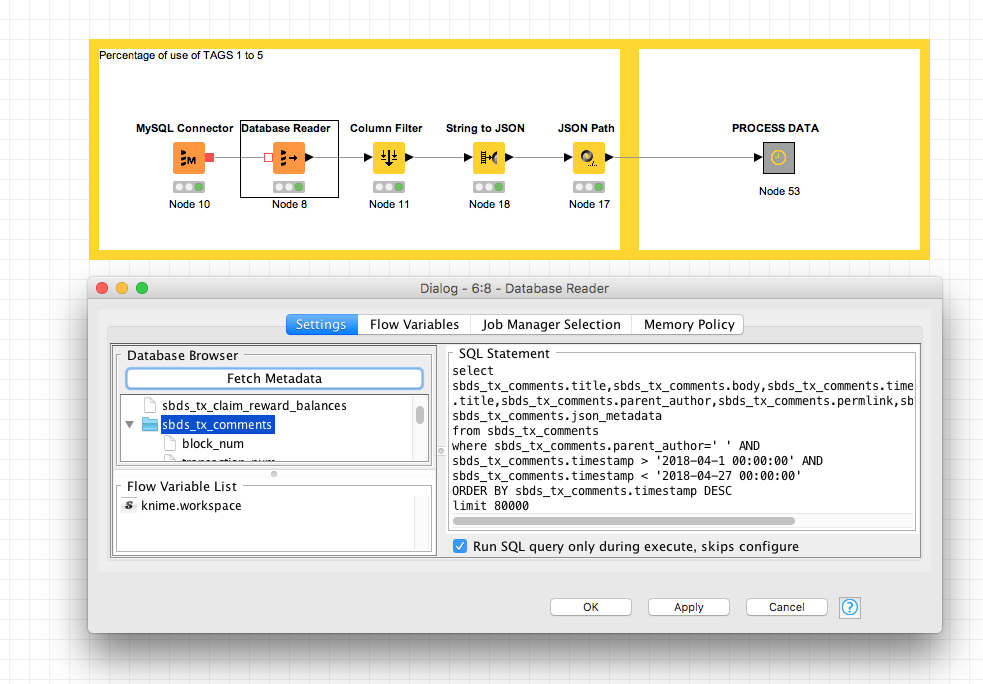
I have been carrying out this analysis trying to answer the following questions:
Question 1:
What is the percentage of use of the five available tags?
TABLE 1: Percentage of use of tags [1 to 5]
| TAG#1 | TAG#2 | TAG#3 | TAG#4 | TAG#5 | |
|---|---|---|---|---|---|
| USED | 100,00% | 92,08% | 87,75% | 80,72% | 67,67% |
| NOT USED | 0,00% | 7,92% | 12,26% | 19,28% | 32,33% |
CHART 1. Percentage of use of tags [1 to 5]
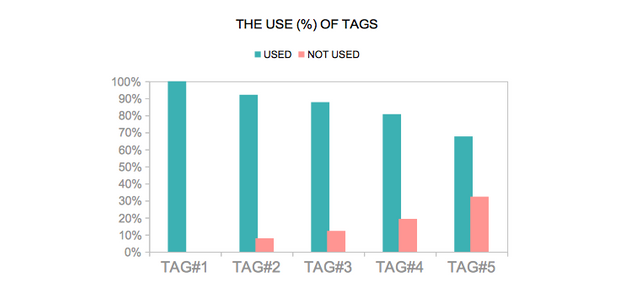
There are two different behaviors when tagging a post according to the number of tags used:
- One more "ACTIVE" which is the predominant where all the five tags are used (67,67% of the posts), and
- Another more "PASSIVE" in which it is decided, for whatever reason, not to use all the tags. The 7,92% of the posts use only one tag and reaching the 32,33% of the posts not using the fifth tag.
Question 2:
What percentage of use would have some aditional tags?
While Steemit.com only allows five tags, the blockchain has no such limits. For this reason, some third-party applications allow users the ability to attach additional tags.
With the above data I have made two simple regressions to answer that question.
TABLE 2. Estimates of the use of additional tags
| Aditionals Tags | ^used | ^not used |
|---|---|---|
| TAG6 | 59,31% | 40,69% |
| TAG7 | 50,75% | 49,25% |
| TAG8 | 42,19% | 57,81% |
| TAG9 | 33,63% | 66,37% |
CHART 2.
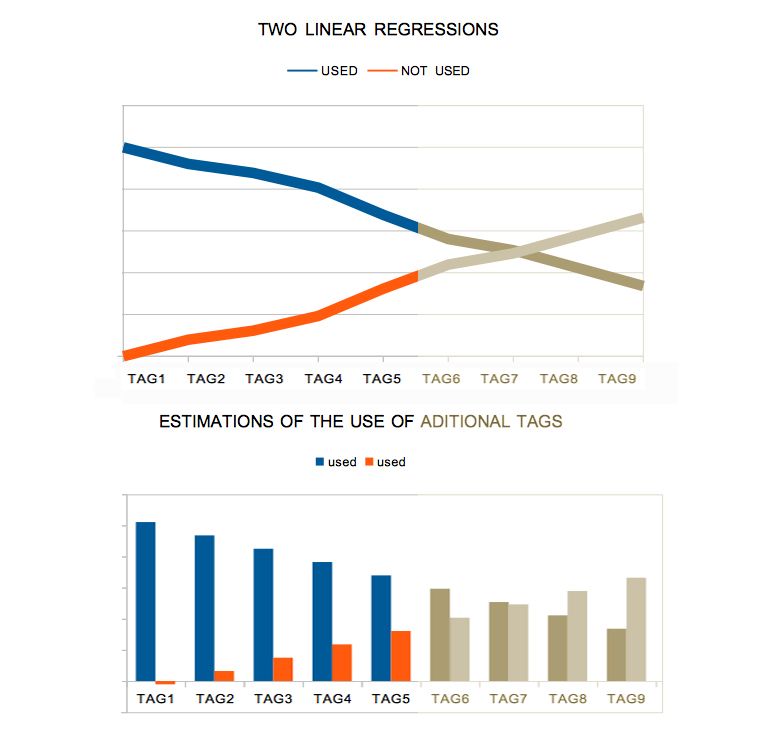
According to these estimates, the 59.31% of the posts would use a sixth tag and even 33.63% of the posts would use up to a ninth tag.
Question 3:
A special case, tag#1
The primary (first) tag is mandatory and is actually not a tag at all. It is a category. It visually looks like a tag but the blockchain does not treat it the same as the others. It cannot be edited after the post is made.
Which are currently the categories with the largest number of posts?
In the 80k posts analyzed there are 7756 categories although most of them contain one or very few posts. The use of tags for the category of a post is very concentrated in a relatively small number of tags. Almost half of the posts (45.41%) are included in only 30 categories.
Let's see this TOP30 categories containing the largest number of posts.
TABLE 3. TOP 30 Categories per number (%) of posts
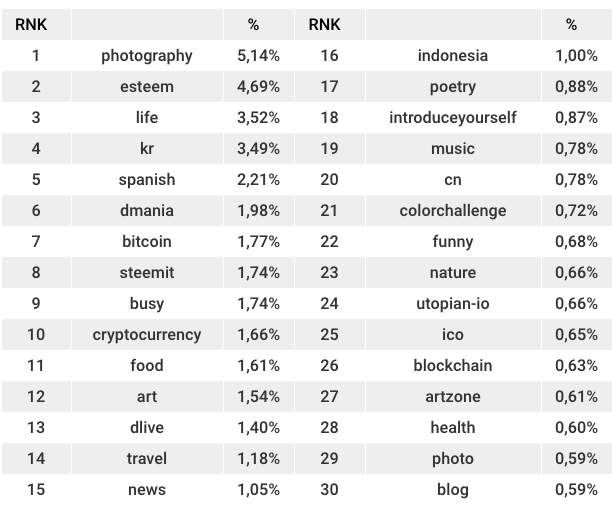
CHART 3. Visual relative proportions of the TOP 30 categories
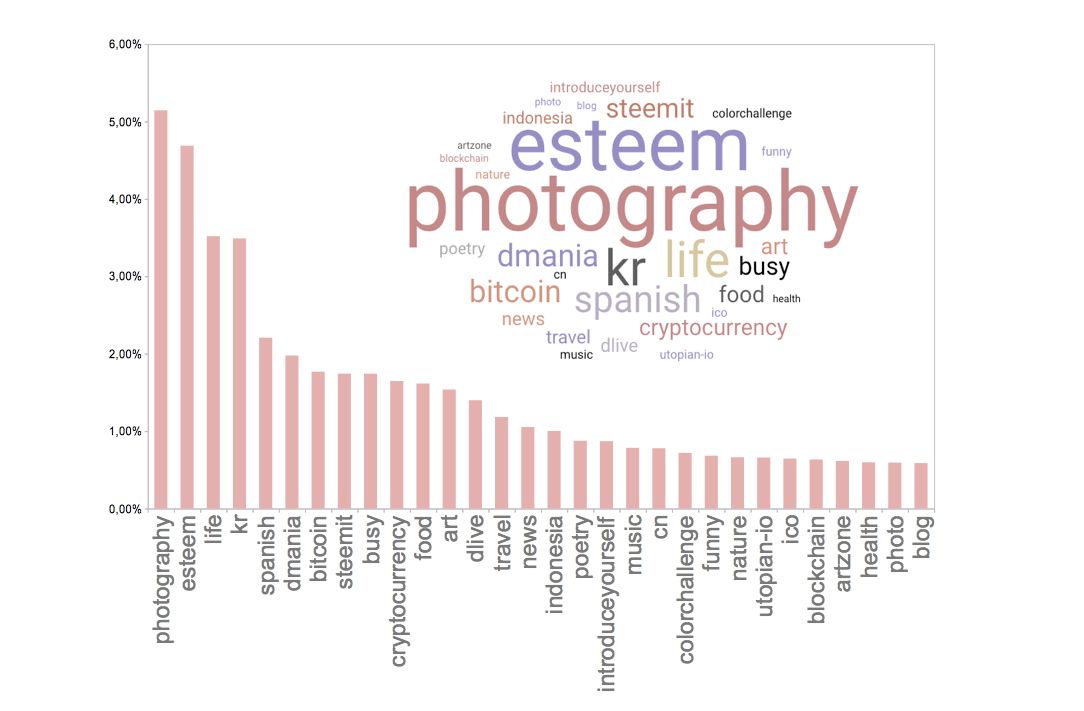
Four categories clearly stand out: photography, esteem, life and kr.
It is striking that there are many categories directly related to images or multimedia: photography, dlive, dmania, colorchallenge, photo.
Question 4:
According to its meaning, in what classes or families of categories could the most popular categories be grouped?
Trying to have an idea of the diversity of strategies that exist in the creation of posts in different categories, I have made a personal classification of the 30 categories in four groups according to the meanings or sense of the categories :
- Language / Geographical
- Generic Topics
- Particular Topics:
- Community Projects:
TABLE: Meta-Categories
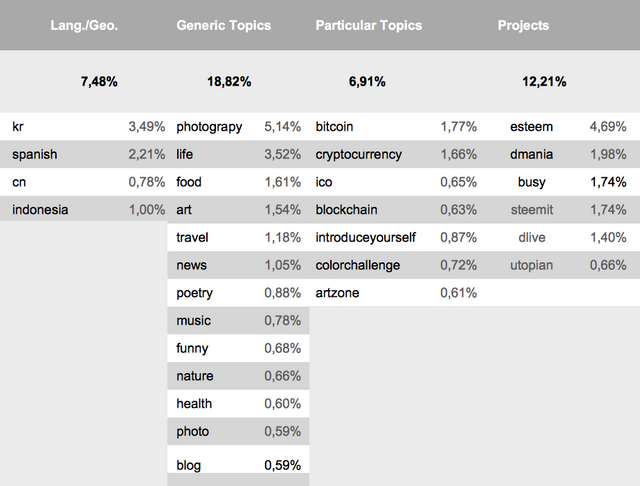
Attending to this grouping of categories, I believe that they could be located between two opposite poles in an imaginary axis of "specificity". A pole focused on general interests and the other pole focused on very specific interests.
It is worth noting the second position of the "Community Projects" family that I think will be the one that grows the most in the future since some of the categories included did not even exist a year ago.
Question 5:
Is the Steemit frontend tag menu sorted by following the volume of posts created for each category?
Tags featured on the side of the home page are listed in descending order based on their popularity. It does not mean that these are the best tags, only that more posts use them than other tags.
But the key question here is how exactly is popularity measured? Does the popularity index exactly match the percentage of the number of posts included in a category during a certain period of time?
I have compared the status of the current tags-menu with the results obtained with my data covering a very recent week. They looks similar but there are some differences.
According to this, some categories have been strengthened or placed in higher positions and others have been degraded or placed in lower positions than they would be due to the volume of posts under those categories.
This is a summary of some categories and the number of positions that have been raised and lowered.
| + Raised Categories | + Lowered Categories. |
|---|---|
| new (+59) | fun (-46) |
| video (+54) | esteem (-46) |
| money (+42) | dmania (-30) |
| dtube (+36) | busy (-18) |
| myanmar (+29) | poetry (-13) |
| contest (+26) | blockchain (-11) |
| steem (+23) | utopian-io (-8) |
| sports (+20) | entertainment (-8) |
| blog (+17) | deutsch (-6) |
| science (+17) | tr (-6) |
I do not know the reasons for this variation, perhaps the metric to measure the popularity of a category add other variables besides the number of posts created in a category or simply have exceptions to enhance some of them.
Question 6:
Is there a temporal dynamic in the use of the main categories?
Are the Top100 categories the same as a year ago?
I got another set of samples of 80k posts created in the same week but on April 2017 and calculated the TOP100 categories to compare with the one obtained for April 2018.
58 categories changed in the Top100.
This is a summary of these categories.
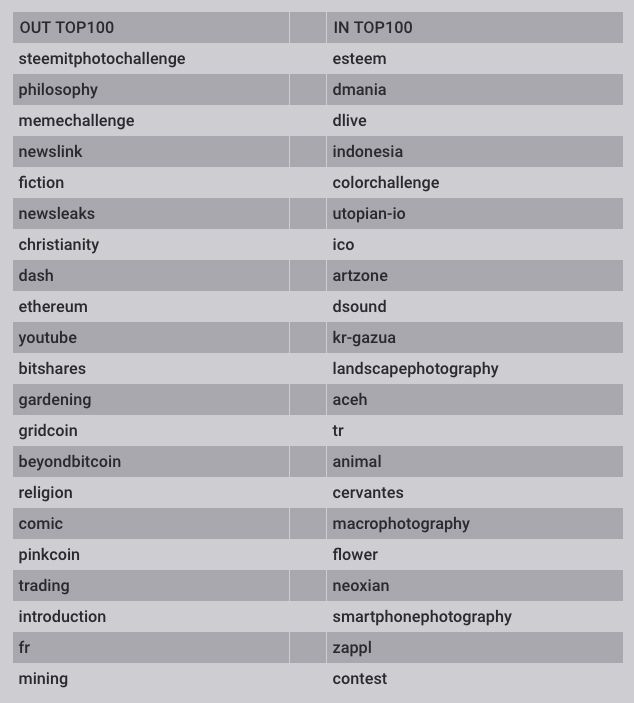
This demonstrates the logic that the most popular categories change since the people who join incorporate different interests, new projects and, of course, changes in the "real world" must be reflected in the choice of categories.
Question 7:
Are the tags used correctly?
Are they used to classify and facilitate access to posts or is it about increasing visibility, comments and votes?
Is a category chosen because of the content of the post or because it is a highly populated category and it seems that this will provide more visibility?
Identifying "True Categories" and "Fake Categories"
I have calculated the percentage of appearance of each of the tags that identify the categories belonging to the top30 in the different positions of Tags: [Tag2, Tag3, Tag4 and Tag5].
This is a summary with six categories whose behaviors show what I want to highlight
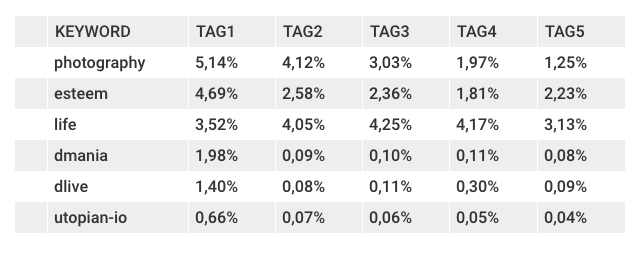
The variations of these percentages denote two different behaviors.
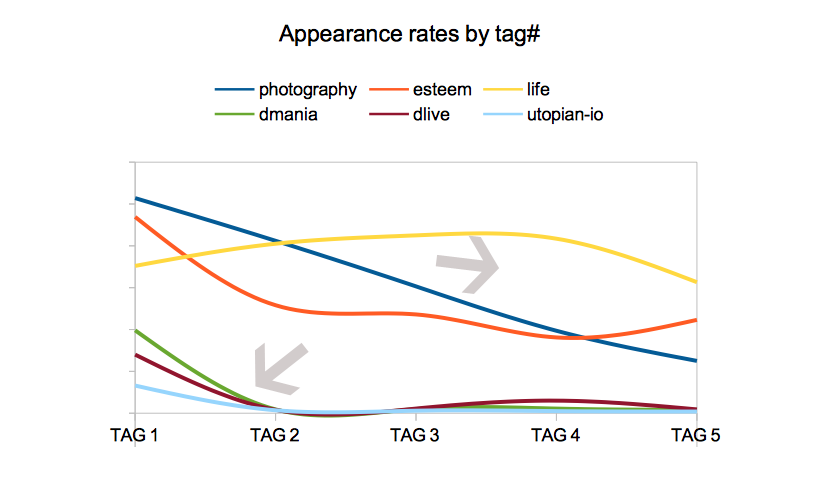
Some keywords (photography, life, esteem) keep appearing at positions tag2 to tag5 with percentages that fluctuate in high relative values.
On the other hand, for other keywords (dmania, dlive, utopian-io), the percentage of appearance in the TAG1 position is high and it decreases drastically for the following positions from tag2 to tag5.
I think the first behavior indicates that these categories are used mainly as promotion because they are very popular. The labeling process is like "centrifugal", trying to cover the most popular categories as much as possible.
On the contrary, the second case denotes a tag used as such, that is, as a way to classify the content of the post or a community or project. The tagging use is like "centripetal", trying to adjust the description of the content, choosing the correct tag, even if it is not related to a popular category.
Another way of looking at this more visually .
For a certain category (given by the content of tag1), what others tags are used more frequently in the subsequent tags?
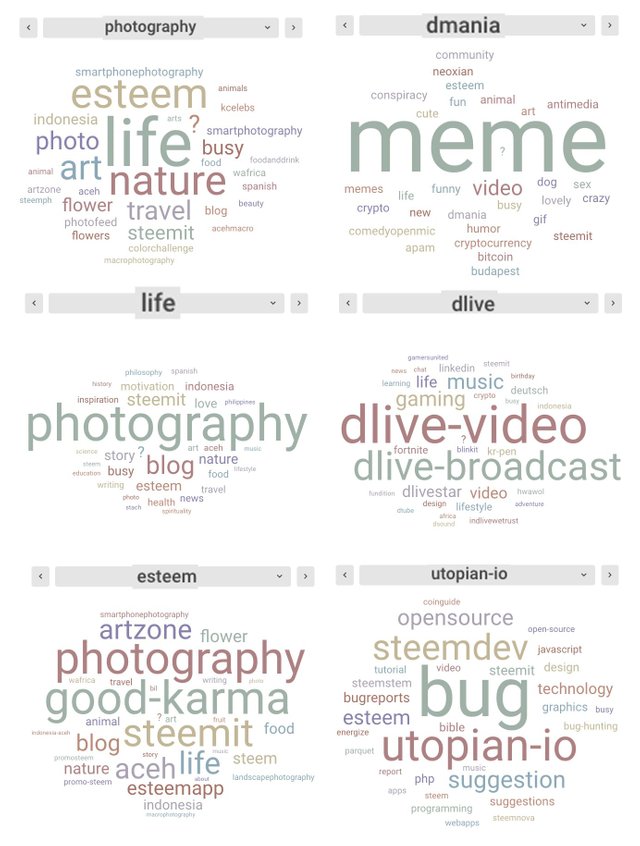
In the column on the left you can distinguish that the most used tags are still the most popular categories and in the column on the right the tags that appear are more specific and less popular.
In conclusion, more than talking about true and fake categories, I would speak of "broadband or centrifugal categories" and "narrowband or centripetal categories".
Question 8:
Why is the "photography" category so big?
Is there a genuine interest in photography?
Since the inclusion of a photograph is enough to justify the inclusion of a post in this category (avoiding spam tag) without the need to create an extensive text that involves more effort and time.
Is it possible that some use of this category is a way to avoid the need to create long texts?
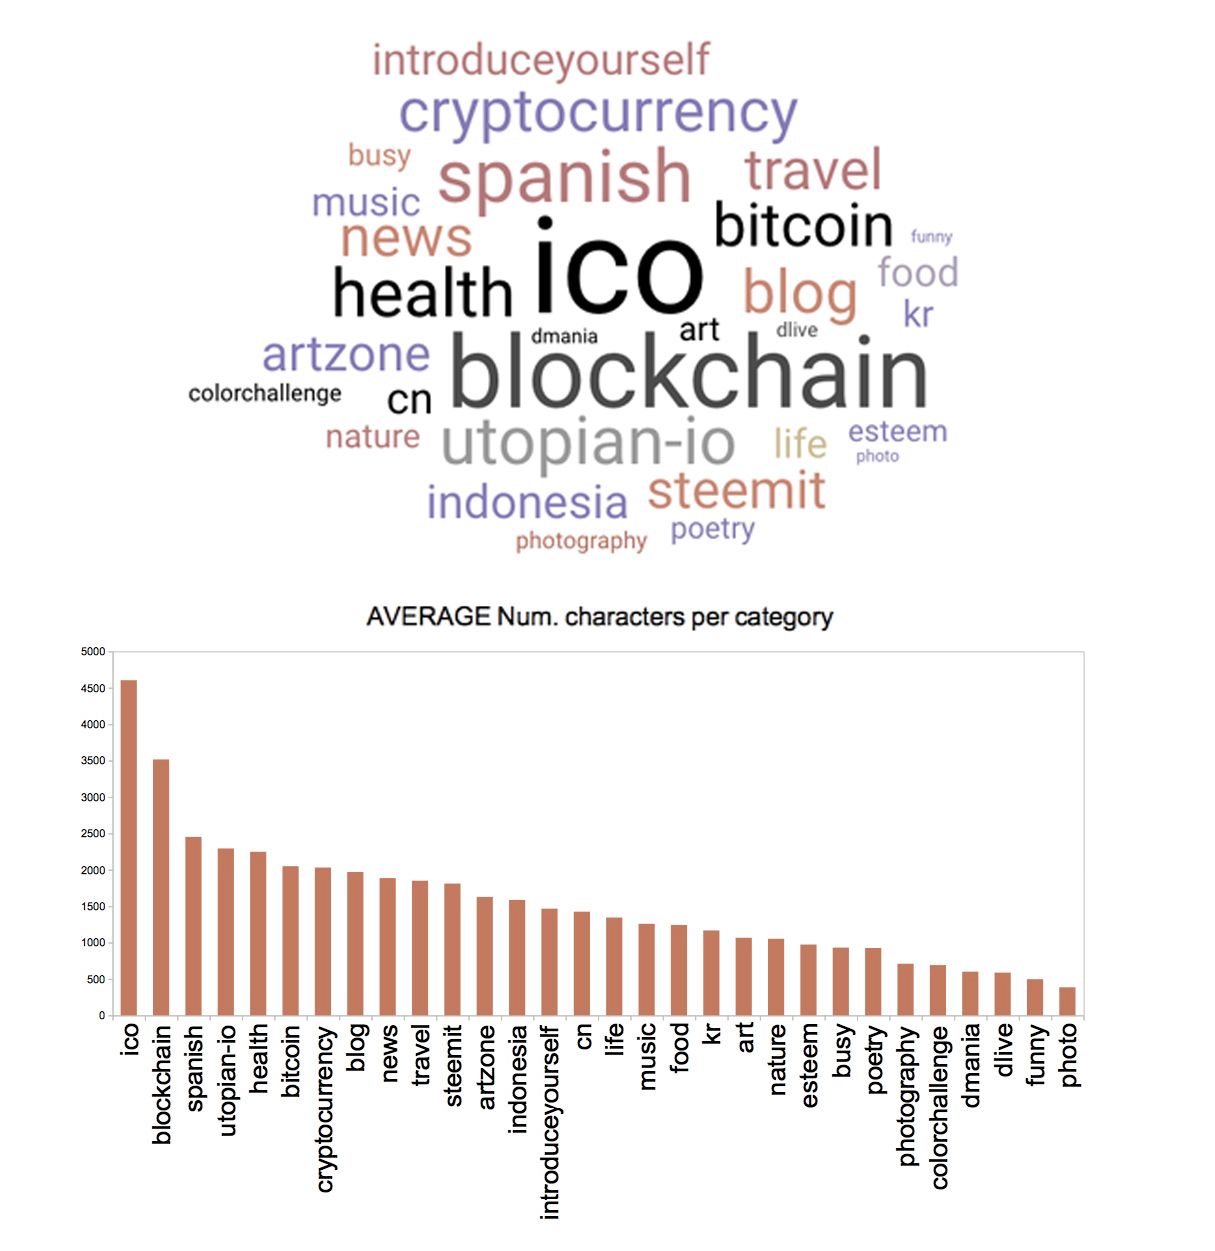
Trying to find out this I have calculated the Average number of characters included in the posts for each of categories getting another different top 30.
The results are:
AVRG = Average number of characters per post
| Category | AVRG | Category | AVRG |
|---|---|---|---|
| ico | 4603 | life | 1343 |
| blockchain | 3515 | music | 1257 |
| spanish | 2451 | food | 1241 |
| utopian-io | 2292 | kr | 1166 |
| health | 2246 | art | 1065 |
| bitcoin | 2049 | nature | 1051 |
| cryptocurrency | 2030 | esteem | 972 |
| blog | 1969 | busy | 930 |
| news | 1885 | poetry | 925 |
| travel | 1849 | photography | 708 |
| steemit | 1810 | colorchallenge | 690 |
| artzone | 1627 | dmania | 600 |
| indonesia | 1585 | dlive | 587 |
| introduceyourself | 1465 | funny | 496 |
| cn | 1424 | photo | 385 |
The truth is that the photography category is one of those with the lowest average number of characters per post and taking into account that the category with the lowest average is "photo" seems to show that these posts are the ones that require less effort in agreement to the previous deduction.
But it can not be said that it is a matter of laziness but to increase performance or simply that many people use a more visual communication.
I think this can be justified by looking at the categories in the lower part of the table where we can find projects like dlive.io and dmania.io in which the information is included in images and videos and this also requires considerable effort and time.
Therefore this can be seen as a segmentation of the steem/steemit ecosystem in categories centered on the creation of content in text format and other categories centered on the creation of content in visual (or audiovisual) format.
As "Virtue is the golden mean between two extremes" I conclude this analysis by showing a hybrid chart that visually represents the previous table.
TOP 30 Categories sorted by average number of characters per post
SUMMARY AND FINAL CONCLUSIONS
In this analysis, I have investigated the following aspects of the use of tags in Steem/Steemit.
- The utilization rates of the five available tags and an estimate of the use of additional tags that show that more tags would theoretically be used.
CONCLUSIONS:
The general behavior is to use all the available tags although up to 7.92% of the posts only use one tag.
- The distribution of the percentages in the number of posts under each category showing details for the top30 in table and graphs.
CONCLUSIONS:
Almost half (45,41%) of the posts are labeled in one of the 30 most popular categories.
- The nature of the categories
in the top30 and its grouping into classes or families.
CONCLUSIONS:
They can be classified into four classes that cover a spectrum, in their tagging behavior that could be located between two opposite poles in an imaginary axis of "specificity". A pole focused on general interests and the other pole focused on very specific interests.
- Analysis of the order of the tag menu in the Steemit frontend.
CONCLUSIONS:
Some categories have been strengthened or placed in higher positions and others have been degraded or placed in lower positions than they would be due to the volume of posts under those categories.
- Analysis of the temporary changes of the categories belonging to the top100 in the last year.
CONCLUSIONS:
There is a significant variability in Top100 categories since 58% of the categories have changed in the last year.
- Analysis of the different uses or behaviors in the tagging process.
CONCLUSIONS:
There are two very different trends, one that tends to promotion in popular categories and another that tends to concreteness in the subject treated in the post.
- Trying to reveal the reason for the great relevance of the photography category I analyzed the categories according to the averages of the amount of text contained in the posts, measured in number of characters, generating another top30 with a very different ranking.
CONCLUSIONS:
There is a segmentation between categories centered on the creation of content in text format and other categories centered on the creation of content in visual (or audiovisual) format.
SCOPE, TOOLS AND CODE
Scope of Analysis
- Date when submitting this analysis: 3.05.2018
- Timeframe of the analysed data: 10.04.2018 to 16.04.2018
- Dates working on this analysis: 28.04.2018 to 03.05.2018
Tools
I have used KNIME, a free and open-source data analytics, reporting and integration platform, to get, filter and manipulated data from the database Steem (sbds.privex.io) and infogram.com and Open Office to make charts.
Workflows Overview
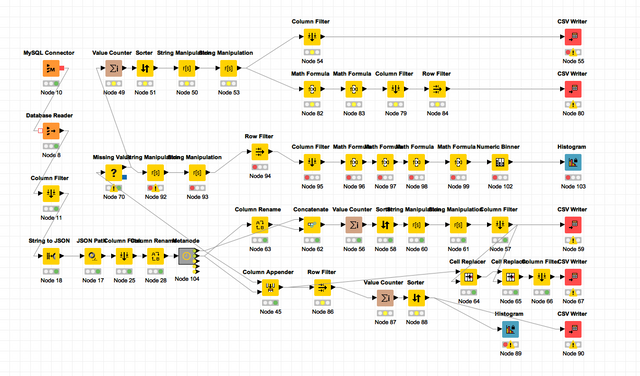
Code
 SQL Query Using the database Reader node in KNIME
SELECT

sbds_tx_comments.title,sbds_tx_comments.body,sbds_tx_comments.timestamp,sbds_tx_comments.title,sbds_tx_comments.parent_author,sbds_tx_comments.permlink,sbds_tx_comments.author,sbds_tx_comments.json_metadata
FROM sbds_tx_comments
WHERE sbds_tx_comments.parent_author=' ' AND
sbds_tx_comments.timestamp > '2018-04-10 00:00:00' AND
sbds_tx_comments.timestamp < '2018-04-16  00:00:00'
ORDER BY sbds_tx_comments.timestamp DESC
LIMIT 80000
Great work @sintoniz, accepted for utopain! It's the first contribution using SBDS that I know of :)
I haven't used SBDS much myself, but if I understand it correctly it "only" contains the blockchain operations, so your data might contain the same post multiple times if that post was edited. Did you filter duplicate permlinks?
Opps! I was not aware of this effect!!
I've been investigating it and the duplicated posts (due to re-editing) can reach an average of 30% which has surprised me a lot.
"Fortunately" this effect occurs in all categories. As I had used comparative rates, the results not vary significantly (0.644% the most). Only some categories with very similar values permute their positions in the rankings.
Without a doubt this effect must be taken into account because in other types of analysis the results can vary substantially.
Thanks for showing me this!
Great Read! Check out my post as well.
Hi @sintoniz, your post is in the utopian to-be-reviewed list - do you plan to add something here?
hi @crokkon,
I was confused with my contribution. I had some technical difficulty that also coincided with the unexpected event in utopian-io.
My post was posted on steemit but the text "Posted on Utopian.io - ...." did not appear and that's why I decided to delete it to try again later.
From what I understand of your comment, it seems that my post is ready for review.
I also just watched a video where it seems that you can keep sending contributions.
https://www.youtube.com/watch?time_continue=150&v=8S1AtrzYY1Q
So I've added it again from Steemit because utopian.io is not available yet.
I hope to do the right thing. In any case I will be attentive to your comments. Thank you.
Hey @sintoniz
We're already looking forward to your next contribution!
Contributing on Utopian
Learn how to contribute on our website or by watching this tutorial on Youtube.
Utopian Witness!
Vote for Utopian Witness! We are made of developers, system administrators, entrepreneurs, artists, content creators, thinkers. We embrace every nationality, mindset and belief.
Want to chat? Join us on Discord https://discord.gg/h52nFrV